Heart failure develops over years, yet many biomarker studies measure metabolites at only one time point. Cross-sectional associations can identify molecular differences, but they cannot show when those differences first emerged or whether they preceded disease. A 2026 Circulation Research study addressed this gap by profiling repeated serum samples from the China Multi-Provincial Cohort Study (CMCS). The investigators analyzed 4,774 samples from 1,728 participants across four time points and reconstructed metabolic changes during the two decades preceding heart failure. MetwareBio provided the TM Widely-Targeted Metabolomics analysis for the project (Li et al., 2026).
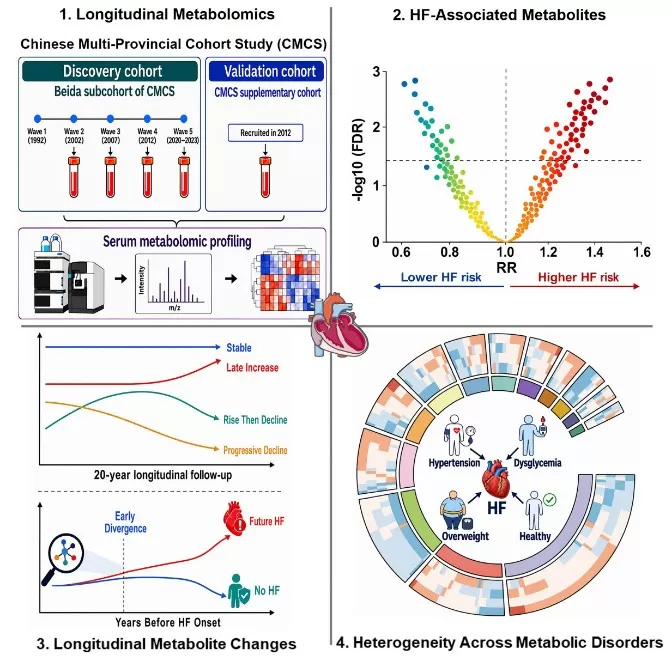
Figure 1. Graphical overview of the longitudinal serum metabolomics study that identified heart failure-associated metabolite profiles and metabolic trajectory patterns before clinical diagnosis. Source: Reproduced from Li et al. (2026), Circulation Research, “Metabolomic Profiles and Changes During the 20 Years Preceding Heart Failure,” Graphical Abstract. DOI: 10.1161/CIRCRESAHA.126.328542.
1. WHAT IS LONGITUDINAL METABOLOMICS?
Longitudinal metabolomics measures metabolites from the same individuals at multiple time points. This design adds temporal information that a single blood draw cannot provide: researchers can distinguish persistent between-person differences from changes that emerge as disease develops, estimate when future cases begin to diverge from controls, and model whether those differences remain stable, increase, or resolve.
That distinction is central to biomarker research. A metabolite that changes only near diagnosis may be useful for short-term risk assessment, whereas a reproducible difference that appears years earlier may be more relevant to etiologic research, early stratification, or mechanistic follow-up. Repeated measurements also improve the ability to evaluate age, medication, lifestyle, comorbidity, and other time-varying influences.
Table 1. Cross-sectional vs longitudinal metabolomics in biomarker research
| Question | Cross-Sectional Metabolomics | Longitudinal Metabolomics |
|---|---|---|
| When is the sample collected? | Usually one time point | Multiple time points from the same individual |
| What can it reveal? | Disease-associated differences | Timing, direction, and persistence of metabolic change |
| Main limitation | Cannot determine when differences emerged | Requires repeated sampling, batch control, and longitudinal modeling |
| Best use case | Discovery screening or case-control comparison | Disease trajectory research, early-risk biology, and biomarker prioritization |
2. WHY SINGLE-TIME-POINT BIOMARKER STUDIES MISS EARLY DISEASE TRAJECTORIES
A single metabolomics profile can show whether future cases and controls differ at the time of sampling. It cannot determine whether that difference is a stable baseline trait, an early disease signal, a late consequence of metabolic decompensation, or a technical artifact related to sampling and batch effects. Longitudinal metabolomics addresses this gap by placing molecular differences on a timeline.
For chronic diseases such as heart failure, timing matters. A metabolite that diverges 15 years before diagnosis suggests a different biological and translational question than a metabolite that changes only during the final years before clinical disease. This is why longitudinal data can strengthen biomarker prioritization even when the final output is still a candidate list rather than a clinical test.
3. CASE STUDY: METABOLIC CHANGES DETECTED UP TO 20 YEARS BEFORE HEART FAILURE
3.1 Study Design: 4,774 Serum Samples Across Four Time Points
The CMCS analysis included participants without heart failure at baseline and metabolomics measurements from 2002, 2007, 2012, and 2020-2023. An intensity model assessed associations between time-updated metabolite levels and heart failure risk; a Cox proportional-hazards model assessed cumulative exposure. Longitudinal modeling was then used to estimate metabolic trajectories before diagnosis (Li et al., 2026).
Table 2. Study design summary for the CMCS longitudinal metabolomics analysis
| Study component | Details |
|---|---|
| Participants | 1,728 participants without heart failure at baseline |
| Follow-up | Approximately 20 years |
| Metabolomics time points | 2002, 2007, 2012, and 2020-2023 |
| Serum samples | 4,774 |
| Study-specific metabolite dataset | 784 metabolites |
| Core analyses | Time-updated association, cumulative exposure, trajectory modeling, and external validation |
MetwareBio provided TM Widely-Targeted Metabolomics for this cohort. This workflow combines high-resolution untargeted MS/MS acquisition with targeted MRM-based quantification, supporting broad metabolite discovery and reproducible comparative analysis. Metabolite coverage depends on sample type, platform, database matching, and quality criteria; final detectable or quantifiable features should be discussed during study design.
3.2 Heart Failure-Associated Metabolites Identified in the Cohort
Among the 784 metabolites, 23 remained significantly associated with heart failure risk after false discovery rate correction. Twenty were positively associated and three were negatively associated. The set included amino acids, acylcarnitines, nucleotides, and other metabolite classes. Nine associations had not previously been reported for heart failure, and six were directionally replicated in an independent cohort (Li et al., 2026).
3.3 Metabolic Divergence Began 15-20 Years Before Diagnosis
The strongest result was temporal: most of the 23 significant metabolites began to diverge between future cases and controls approximately 15-20 years before clinical heart failure. Kynurenine-pathway metabolites diverged roughly 17-19 years before diagnosis, and acylcarnitine C16:3 diverged about 18-20 years beforehand. The timing and direction of change differed across metabolites (Li et al., 2026).
These findings do not constitute a clinical test that predicts heart failure two decades in advance. They identify a prolonged preclinical window in which metabolic biology differs between future cases and controls, providing candidates for replication, mechanistic studies, and risk-model development.
3.4 Four Longitudinal Metabolite Trajectory Patterns
Trajectory analysis grouped 173 nominally associated metabolites into four patterns: relatively stable, late increase, increase followed by decline, and progressive decline. Positive risk associations were more common among stable or rising patterns, whereas several negatively associated glycerophospholipids declined over time (Li et al., 2026).
Trajectory information can help distinguish persistent early signals from markers of later metabolic decompensation. Two metabolites may show similar cross-sectional associations but have very different temporal behavior and therefore different value for prediction or mechanism studies.
3.5 Metabolic Background Modified Heart Failure-Associated Signals
Associations also differed across metabolic subgroups. In participants with hypertension, enriched pathways included arginine biosynthesis and one-carbon metabolism. Overweight or obesity was characterized by arginine-proline metabolism, whereas dysglycemia showed enrichment of bile acid biosynthesis. These differences support stratified analyses rather than assuming a single heart-failure metabolomic signature across all patients (Li et al., 2026).
4. FROM METABOLITE ASSOCIATION TO BIOMARKER CANDIDATE
4.1 Why Significant Metabolites Are Not Yet Validated Biomarkers
A statistically significant molecule is a biomarker candidate, not a validated biomarker. Translation requires several layers of evidence: analytical reproducibility, control of confounding, replication across populations, temporal consistency, and quantitative validation when appropriate. For prediction, candidate markers should also be tested for incremental value beyond established clinical variables.
The heart failure study strengthens prioritization by combining repeated measurements, two association models, trajectory analysis, subgroup analysis, and external replication. Those steps do not establish clinical utility, but they narrow the field to signals that merit targeted validation and mechanistic follow-up (Li et al., 2026).
Table 3. Evidence needed before a metabolite becomes a biomarker
| Evidence layer | Why it matters |
|---|---|
| Analytical reproducibility | Confirms that the signal is not driven by platform variation |
| Independent replication | Tests whether the association holds in another cohort |
| Confounder adjustment | Evaluates age, sex, medication, lifestyle, comorbidity, and metabolic status |
| Temporal consistency | Determines whether the metabolite changes before, near, or after disease onset |
| Targeted validation | Confirms prioritized candidates with a quantitative assay when appropriate |
| Incremental prediction | Tests whether the candidate improves models beyond established clinical variables |
5. HOW TO DESIGN LARGE-SCALE LONGITUDINAL METABOLOMICS COHORT STUDIES
Scaling metabolomics from tens of samples to hundreds or thousands changes the study-design problem. Pre-analytical variation, run-order effects, inter-batch drift, missingness, and confounding can accumulate across long acquisition periods. These risks should be addressed prospectively rather than treated only as downstream data-cleaning problems.
5.1 Standardize Sample Collection and Handling
Collection tube, fasting status, time to centrifugation, storage conditions, freeze-thaw history, and handling should be standardized wherever feasible. For longitudinal studies, procedures should remain consistent across time points. Biological groups and key covariates should also be balanced across preparation plates and analytical batches to avoid confounding with run order (Kim et al., 2021).
5.2 Balance Metabolite Coverage With Reproducibility
Broad coverage is useful for discovery, but the relevant question is not simply how many features are detected. Missing-value rate, signal stability, quantitative reproducibility, annotation confidence, and consistency across the full cohort determine how much of that coverage is analytically useful. Platform choice should therefore follow the research objective rather than a single coverage metric. When metabolite identity or quantification is central to biomarker interpretation, researchers should distinguish annotation confidence, QC performance, and assay validation status rather than treating all detected features as equally actionable (Sumner et al., 2007).
5.3 Control Batch Effects and Long-Term Instrument Drift
Cohort-scale acquisition may run for weeks or months. Pooled or reference QC samples, blanks, internal standards, repeated system checks, and batch-aware correction are essential for distinguishing technical drift from biology. Published large-cohort workflows have shown that explicit monitoring and correction of run-order and inter-batch variation improve data reliability (Kim et al., 2021; Hirayama et al., 2023).
MetwareBio uses process quality control (PQC), long-term quality control (LQC), and mass-spectrometry quality control (MQC) across large-cohort metabolomics workflows, with MetCorrect applied at the data level. The objective is to keep biological variation interpretable across the full sample series.

Figure 2. Example QC design for large-cohort longitudinal omics studies.
5.4 Match Statistical Analysis to the Study Design
Large datasets can generate many nominally significant associations. Multiple-testing correction, prespecified outcomes, appropriate covariate modeling, repeated-measures methods, and time-to-event analysis should be aligned with the study question. Independent replication is preferable when available; otherwise, resampling or split-sample validation can reduce overinterpretation of unstable signals.
6. IMPLICATIONS FOR EARLY DISEASE BIOLOGY AND PREVENTION RESEARCH
The main contribution of this study is the temporal map rather than any single metabolite. Heart failure-associated metabolic differences were detectable long before diagnosis, followed distinct trajectories, and varied by metabolic background. That pattern supports a model in which chronic disease risk evolves through measurable molecular stages rather than appearing abruptly at diagnosis.
This research framing also fits current heart failure guidance, which emphasizes early disease stages and prevention-oriented management of risk factors rather than waiting for symptomatic disease (Heidenreich et al., 2022; McDonagh et al., 2021). Future work can test whether these metabolomic signals replicate in more diverse populations, improve risk prediction beyond standard clinical factors, or identify biological pathways that merit mechanistic follow-up.
Longitudinal metabolomics can also be integrated with imaging, genetics, proteomics, transcriptomics, and other molecular data when those layers address a defined mechanistic or predictive question. The goal is not to add more omics layers by default, but to design a workflow that connects molecular measurement with a testable research question.
7. FAQ ON LONGITUDINAL METABOLOMICS AND HEART FAILURE BIOMARKERS
7.1 What is longitudinal metabolomics?
Longitudinal metabolomics measures metabolites in the same individuals at multiple time points. It is used to model metabolic trajectories and determine whether molecular differences precede, accompany, or follow disease development.
7.2 Can metabolomics identify heart failure risk before symptoms appear?
Metabolomics can identify molecular patterns associated with future heart failure before clinical diagnosis. In this cohort, many differences emerged 15-20 years earlier. These associations still require independent validation before clinical use.
7.3 Does this study mean heart failure can be predicted 20 years in advance?
No. The study shows that metabolic differences associated with future heart failure were detectable years before diagnosis in a research cohort. These findings do not establish a clinical prediction test. They provide biomarker candidates and metabolic trajectories for replication, mechanistic interpretation, and validation.
7.4 Why are repeated blood samples valuable for biomarker discovery?
Repeated samples provide temporal information. They help distinguish stable individual differences from progressive disease-related changes and clarify whether a candidate marker appears before the clinical endpoint.
7.5 What are the main technical challenges in large-scale metabolomics?
Key challenges include pre-analytical variation, batch imbalance, instrument drift, run-order effects, missing values, and confounding between biological groups and analytical batches. Standardization, randomization, repeated QC, and batch-aware processing are therefore essential.
7.6 Why is quality control critical in longitudinal metabolomics?
Quality control is critical because longitudinal studies compare samples collected or analyzed across long time periods. Without pooled QC samples, internal standards, batch balancing, and drift correction, technical variation can be mistaken for biological change. Strong QC helps preserve the interpretability of metabolic trajectories.
7.7 How should candidate metabolomic biomarkers be validated?
Validation typically includes analytical reproducibility, replication in an independent cohort, assessment of confounders and subgroup effects, and targeted quantitative measurement of prioritized candidates. Predictive markers should also demonstrate value beyond established clinical predictors.
MetwareBio: Your Trusted Partner for Longitudinal Metabolomics and Biomarker Research
MetwareBio supports cohort-scale and mechanism-focused research through TM Widely-Targeted Metabolomics, untargeted metabolomics, targeted metabolomics, quantitative lipidomics, proteomics, transcriptomics, microbiome-metabolome integration, spatial omics, and multi-omics data analysis.
For longitudinal or large-cohort studies, our team can help researchers align sample type, cohort size, batch design, quality-control strategy, and downstream interpretation with the study objective. These workflows are especially useful for biomarker discovery, metabolic trajectory analysis, disease-mechanism research, and follow-up validation of prioritized candidates. For large-cohort blood-based projects, researchers can also explore MetwareBio’s limited-time plasma DIA proteomics promotion, starting at $299/sample.
Planning a longitudinal metabolomics or biomarker discovery project? Contact MetwareBio to discuss sample type, cohort size, analytical workflow, and validation strategy.
Contact Us8. CONCLUSION
Longitudinal metabolomics can turn a biomarker study from a static comparison into a temporal map of disease biology. In the CMCS heart failure analysis, repeated serum metabolomics revealed candidate metabolites, pathway-level heterogeneity, and metabolic divergence years before diagnosis. For researchers planning cohort-scale biomarker studies, the lesson is clear: temporal design, rigorous quality control, and validation strategy determine whether metabolomic signals become interpretable biological evidence.
9. Read More: Metabolomics Biomarker Discovery and Cohort Study Design
These articles cover the metabolomics platforms, metabolite classes, data processing workflows, and multi-omics strategies that support longitudinal biomarker research — from TM Widely-Targeted Metabolomics through acylcarnitine and kynurenine pathway analysis to large-cohort data processing and multi-omics integration.
This study used TM Widely-Targeted Metabolomics to profile 784 serum metabolites across 4,774 samples. Learn how this hybrid platform combines untargeted discovery with targeted MRM quantification, and when to choose it over purely targeted or untargeted approaches for cohort-scale biomarker research.
Acylcarnitine C16:3 was among the strongest temporal signals, diverging 18-20 years before heart failure diagnosis. Explore acylcarnitine biology, its role in fatty acid oxidation and mitochondrial energetics, and analytical methods for quantifying acylcarnitines in serum.
Kynurenine-pathway metabolites diverged 17-19 years before heart failure in this cohort. This targeted tryptophan metabolomics service covers kynurenine, kynurenic acid, and related metabolites that link inflammation, neurobiology, and cardiovascular risk.
Large-cohort metabolomics requires rigorous preprocessing: missing-value handling, batch correction, normalization, and outlier filtering. This guide walks through the preprocessing pipeline that determines whether biomarker candidates survive downstream statistical validation.
From run-order correction to trajectory modeling, the CMCS study relied on advanced data processing to distinguish biological change from technical drift. Explore the computational methods that make longitudinal metabolomics across thousands of samples interpretable.
The heart failure study highlights integration of metabolomics with clinical covariates, subgroup stratification, and external replication. Discover how multi-omics approaches combine metabolomics, proteomics, and transcriptomics to deepen mechanistic and predictive insights for chronic disease research.
References
- Hirayama, A., Ishikawa, T., Takahashi, H., et al. (2023). Quality Control of Targeted Plasma Lipids in a Large-Scale Cohort Study Using Liquid Chromatography-Tandem Mass Spectrometry. Metabolites, 13(4), 558. https://doi.org/10.3390/metabo13040558
- Heidenreich, P. A., Bozkurt, B., Aguilar, D., et al. (2022). 2022 AHA/ACC/HFSA Guideline for the Management of Heart Failure. Circulation, 145(18), e895-e1032. https://doi.org/10.1161/CIR.0000000000001063
- Kim, T., Tang, O., Vernon, S. T., et al. (2021). A hierarchical approach to removal of unwanted variation for large-scale metabolomics data. Nature Communications, 12, 4992. https://doi.org/10.1038/s41467-021-25210-5
- Li, J., Ding, S., Yang, Z., et al. (2026). Metabolomic Profiles and Changes During the 20 Years Preceding Heart Failure. Circulation Research. https://doi.org/10.1161/CIRCRESAHA.126.328542
- McDonagh, T. A., Metra, M., Adamo, M., et al. (2021). 2021 ESC Guidelines for the diagnosis and treatment of acute and chronic heart failure. European Heart Journal, 42(36), 3599-3726. https://doi.org/10.1093/eurheartj/ehab368
- Sumner, L. W., Amberg, A., Barrett, D., et al. (2007). Proposed minimum reporting standards for chemical analysis: Chemical Analysis Working Group (CAWG) Metabolomics Standards Initiative (MSI). Metabolomics, 3, 211-221. https://doi.org/10.1007/s11306-007-0082-2