Quantitative Lipidomics
What is Quantitative Lipidomics?
MetwareBio's quantitative lipidomics service uses UPLC coupled with triple quadrupole mass spectrometry to detect and semi-quantify more than 4,000 lipid species across 51 lipid classes. The workflow integrates lipid extraction, chromatographic separation, optimized MRM transitions, class-specific internal standards, and standardized quality control to support reliable lipid profiling across common biological matrices, including plasma, serum, tissue, cells, and feces. This service is particularly suitable for studies requiring broad lipidome coverage and consistent quantitative comparison, such as cardiovascular and metabolic disease research, cancer metabolism, neurobiology, pharmacology, nutrition, and inflammation-related studies.
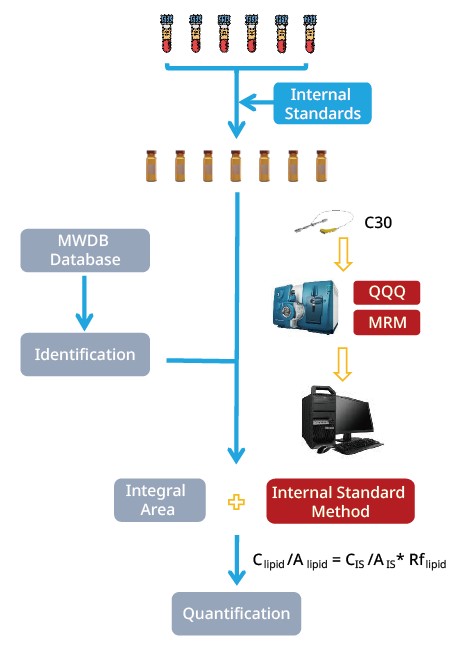
Technical Route of MetwareBio's Quantitative Lipidomics Analysis
Why Choose MetwareBio for Quantitative Lipidomics?
| Category | Representative Classes | Species |
|---|---|---|
| Fatty acyls (FA) | CAR, FFA, Eicosanoid, FAHFA | 270 |
| Glycerolipids (GL) | DG, DG-O, MG, TG, TG-O, MGDG, DGDG | 1,015 |
| Glycerophospholipids (GP) | LPC, LPC-O, LPE, LPE-P, PC, PC-O, PE, PE-P, PE-O, PG, PS, PI, LPA, PA, BMP, and more | 1,800 |
| Sphingolipids (SL) | SPH, CerP, HexCer, SM, Cer, Cert | 828 |
| Sterol lipids (ST) | Cho, CE, BA, CASE | 122 |
| Prenol lipids (PR) | CoQ | 3 |
| Total | 4,000+ |
Project Workflow of Quantitative Lipidomics Service
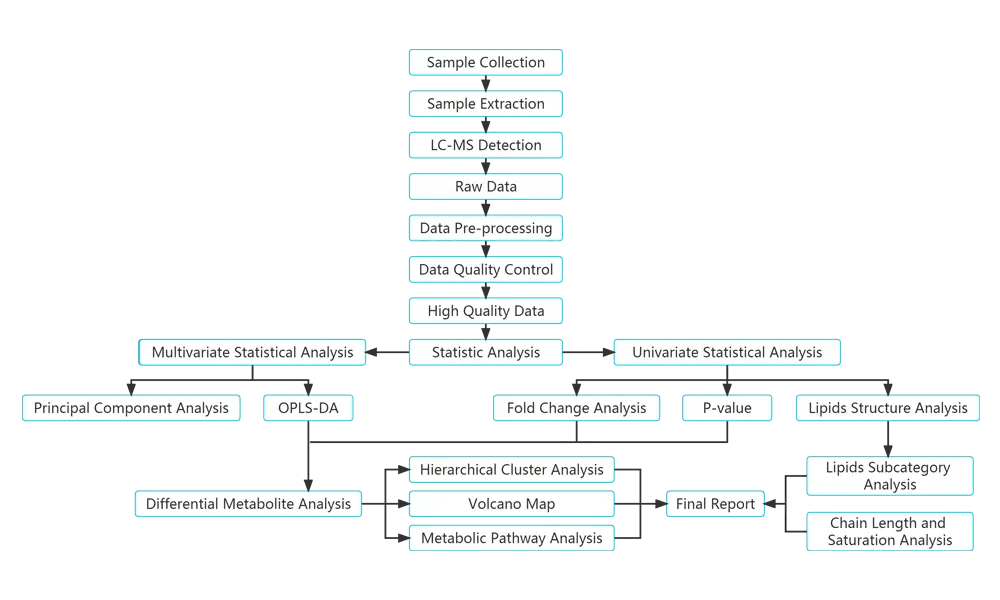
Step-by-Step Workflow of MetwareBio’s Quantitative Lipidomics Analysis: From Sample Treatment to Biological Insights
Lipidomics Data Analysis and Deliverables
Experience in Biomedical and Animal Lipid Profiling
The number of lipids detected in various of sample types
Applications of Quantitative Lipidomics Service
Quantitative lipidomics is widely used to investigate lipid dysregulation in cardiovascular disease, obesity, diabetes, fatty liver disease, and metabolic syndrome. By profiling lipid classes such as triglycerides, phospholipids, sphingolipids, cholesteryl esters, and bile acids, this approach helps identify lipid biomarkers and characterize disease-associated metabolic remodeling.
Lipid metabolism plays a central role in tumor growth, membrane biosynthesis, energy storage, ferroptosis, and cell signaling. Quantitative lipidomics enables systematic analysis of lipid abundance changes in tumor tissues, plasma, serum, cells, and animal models, supporting research on cancer metabolism, therapeutic response, and tumor-associated lipid remodeling.
The nervous system is highly enriched in structurally and functionally diverse lipids, including sphingolipids, glycerophospholipids, and sterol-related lipids. Quantitative lipidomics supports studies of brain lipid metabolism, neuroinflammation, myelin integrity, aging, and neurodegenerative disorders by revealing lipid profile changes associated with neurological function and disease progression.
Quantitative lipidomics provides a useful tool for evaluating how drugs, candidate compounds, or therapeutic interventions affect lipid metabolism. By comparing lipid profiles across treatment groups, researchers can assess drug-induced lipid remodeling, investigate mechanisms of action, monitor metabolic side effects, and support preclinical pharmacology and toxicology studies.
Lipids are important indicators of nutritional status, energy metabolism, immune regulation, growth performance, and physiological stress in human and animal studies. Quantitative lipidomics can be applied to serum, plasma, tissue, milk, feces, and other animal-derived samples to evaluate dietary interventions, metabolic health, disease-associated lipid changes, and phenotype-related lipid regulation.
Quantitative Lipidomics Case Study
Quantitative Lipidomics Reveals Lipid Metabolism Vulnerability in Pancreatic Cancer
In a Nature Communications study titled “Adaptation to cystine limitation stress confers a targetable lipid metabolism vulnerability in pancreatic ductal adenocarcinoma”, researchers investigated how pancreatic ductal adenocarcinoma (PDAC) cells adapt to cystine limitation stress and identified lipid metabolic reprogramming as a targetable vulnerability. The study showed that cystine limitation stress adaptation promotes PDAC tumor growth through metabolic remodeling, while lomitapide disrupts triacylglyceride synthesis and lipid droplet formation, sensitizing PDAC models to chemotherapy. MetwareBio-supported targeted quantitative lipidomics was used to profile lipid changes in PDAC cell models under cystine limitation stress, lomitapide treatment, and mFOLFIRINOX chemotherapy conditions, helping reveal shifts in triacylglycerides, cholesterol esters, free fatty acids, acyl-carnitines, phospholipids, and lysophospholipids. These lipidomics data provided key molecular evidence linking lipid storage, lipotoxic stress, and therapeutic vulnerability in pancreatic cancer.
Volcano plot and heatmap showing that CLSA-mediated lipidomics reprogramming upregulates TG levels in PANC-1 (A) MiaPaCa-2 (B) cells.
Sample Requirements for Lipidomics Analysis
| Sample Class | Sample Type | Recommended Sample Size | Minimum Sample Size |
|---|---|---|---|
| Liquid I | Plasma, serum, hemolymph, whole blood, milk, egg white | 100 μL | 20 μL |
| Liquid II | Cerebrospinal fluid (CSF), interstitial fluid (TIF), uterine fluid, pancreatic juice, bile, pleural effusion, follicular fluid, fallopian tube fluid, postmortem fluid, tissue fluid, culture medium (liquid), culture supernatant, fermentation broth, tears, aqueous humor, digestive juices, bone marrow (liquid) | 100 μL | 20 μL |
| Liquid III | Seminal plasma, amniotic fluid, prostatic fluid, rumen fluid, respiratory condensate, gastric lavage fluid, bronchoalveolar lavage fluid (BALF), urine, sweat, saliva, sputum | 500 μL | 50 μL |
| Tissue I | Small animal tissues, placenta, blood clot, mycelium, nematode, zebrafish (whole fish), bone marrow (solid), nail | 100 mg | 20 mg |
| Tissue II | Large animal tissues, whole insect body, wings of insects, pupa, eggs, large fungi such as mushroom types, large amount of fungal mycelium or mycelial balls, cartilage, bone (solid) | 500 mg | 20 mg |
| Tissue III | Zebrafish organs, insect organs, whole microinsect body, such as Drosophila | 20 units | / |
| Solid I | Feces, intestinal contents, lyophilized fecal powder | 200 mg | 20 mg |
| Solid II | Milk powder, microbial fermentation product (solid), culture medium (solid), earwax, lyophilized tissue powder, feed, egg yolk powder, lyophilized plant powder, lyophilized egg powder | 100 mg | 20 mg |
| Solid III | Honey, nasal mucus, sputum, fresh egg yolk | 100 mg | 20 mg |
| Solid IV | Sludge, soil | 600 mg | 300 mg |
| Cell I | Adherent cells, animal cell lines | 1 × 10⁶ cells | 5 × 10⁵ cells |
| Cell II | E. coli, yeast cells | 1 × 10¹⁰ cells | 5 × 10⁸ cells |
| Cell III | Small amount of fungal mycelial balls or mycelium, cyanobacteria, large amount of bacteria pellet, slime mold, microbial sludge, dried microbial powder | 100 mg | / |
| Organelle I | Lysosomes, mitochondria, endoplasmic reticulum | 4 × 10⁷ cells / 0.2 g tissue | 1 × 10⁷ cells / 0.1 g tissue |
| Organelle II | Exosomes, extracellular vesicles | 2 × 10⁹ particles / 40 μg protein (BCA) | 1 × 10⁹ particles / 20 μg protein (BCA) |
| Special Sample I | Skin tape or patch | 2 pieces | 1 piece |
| Special Sample II | Test strips | 2 pieces | 1 piece |
| Special Sample III | Swab | 1 piece | 1 piece |
FAQ on Quantitative Lipidomics
Quantitative lipidomics uses a predefined lipid panel and targeted LC-MS/MS MRM acquisition to measure known lipid species with higher reproducibility and quantitative consistency across samples. Untargeted lipidomics is more discovery-oriented and is designed to detect broader lipid-related features, but it usually provides less consistent quantification for predefined lipid targets.
| Feature | Quantitative Lipidomics | Untargeted Lipidomics |
|---|---|---|
| Main goal | Semi-quantitative analysis of predefined lipid species | Discovery-driven profiling of lipid-related features |
| Typical MS platform | Triple quadrupole mass spectrometry | High-resolution mass spectrometry |
| Acquisition mode | MRM / targeted acquisition | DDA / untargeted acquisition |
| Lipid coverage | Curated lipid panel, such as 4,000+ lipid species across 51 classes | Broader feature detection, including known and unknown lipid-related signals |
| Quantitative consistency | Higher reproducibility for predefined lipid targets | Lower quantitative consistency for specific predefined lipid targets |
| Best suited for | Group comparison, biomarker validation, lipid remodeling analysis | Discovery studies, unknown feature screening, hypothesis generation |
No. MetwareBio’s standard quantitative lipidomics service provides semi-quantitative lipid abundance using class-specific internal standards and optimized MRM transitions. Absolute quantification requires authentic standards and calibration curves for each target lipid and is usually developed as a dedicated targeted lipidomics method.
MetwareBio’s quantitative lipidomics panel covers 4,000+ lipid species across 51 lipid classes, including fatty acyls, glycerolipids, glycerophospholipids, sphingolipids, sterol lipids, and prenol lipids. Representative lipid subclasses include carnitines, free fatty acids, eicosanoids, DG, TG, LPC, PC, PE, PI, Cer, HexCer, SM, cholesterol, cholesteryl esters, bile acids, and CoQ.
Quantitative lipidomics can distinguish some lipid species based on optimized MRM transitions, chromatographic retention behavior, and database annotation, but not all lipid isomers can be fully resolved in the standard workflow. Positional isomers, such as sn-position isomers and double-bond positional isomers, may require specialized targeted method development or additional structural characterization.
Common sample types for quantitative lipidomics include plasma, serum, urine, milk, cerebrospinal fluid, tissues, cultured cells, microorganisms, feces, intestinal contents, and culture-related liquid samples. Because lipid abundance and matrix effects vary by sample type, sufficient sample input, consistent collection, rapid freezing, and standardized storage are important for reliable lipid profiling.
MetwareBio’s quantitative lipidomics workflow includes class-specific internal standards, pooled QC samples, instrument stability monitoring, QC clustering, coefficient of variation evaluation, and batch correction when appropriate. These quality control measures help evaluate technical reproducibility and improve data comparability across sample cohorts.
Yes. Quantitative lipidomics data can be integrated with metabolomics, transcriptomics, proteomics, and microbiome datasets through pathway analysis, correlation analysis, lipid class-level interpretation, and systems biology analysis. This integration helps connect lipid remodeling with gene expression, protein regulation, microbial activity, and broader metabolic phenotypes.
Reference
Li, Y., Li, Z., Li, Q. et al. Adaptation to cystine limitation stress confers a targetable lipid metabolism vulnerability in pancreatic ductal adenocarcinoma. Nat Commun 17, 1343 (2026). https://doi.org/10.1038/s41467-025-68099-0