Central Carbon Metabolism
Central Carbon Metabolism Analysis by Targeted LC-MS/MS

Why Choose MetwareBio for Central Carbon Metabolism Analysis?
80 Metabolites Across Glycolysis, TCA Cycle, and the PPP
| Metabolic Area | Representative Metabolites | Research Relevance |
|---|---|---|
| Glycolysis and Pyruvate Metabolism | Glucose, glucose-6-phosphate, fructose-6-phosphate, fructose-1,6-bisphosphate, glyceraldehyde-3-phosphate, 3-phosphoglycerate, phosphoenolpyruvic acid, pyruvic acid, lactate | Characterize changes in glucose utilization, glycolysis-associated metabolism, pyruvate-lactate balance, and metabolic reprogramming |
| TCA Cycle and Mitochondrial Organic Acids | Citric acid, isocitric acid, cis-aconitic acid, α-ketoglutaric acid, succinic acid, fumaric acid, malic acid, oxaloacetate, acetyl-CoA, succinyl-CoA | Profile changes in TCA-cycle intermediates, mitochondrial carbon metabolism, and pathway-associated metabolic remodeling |
| Pentose Phosphate Pathway and Sugar Phosphates | 6-Phosphogluconic acid, erythrose-4-phosphate, ribose-5-phosphate, ribulose-5-phosphate, xylulose-5-phosphate, sedoheptulose-7-phosphate, NADPH | Characterize PPP-associated changes related to pentose phosphate metabolism, NADPH availability, redox balance, and biosynthetic precursor supply |
| Energy-Related Nucleotides and Redox Cofactors | ATP, ADP, AMP, adenine, inosine, guanosine, cAMP, GDP, GTP, IMP, UMP, NAD, NADPH, flavin mononucleotide | Assess changes in energy-related nucleotides, nucleotide metabolism, and redox-associated metabolite profiles |
| Amino Acid-Linked Energy Metabolism | Serine, glutamic acid, glutamine, alanine, aspartate, threonine, lysine, tyrosine, arginine, ornithine, leucine, citrulline, cystine | Characterize amino acid-associated metabolic changes and their connections with central carbon and nitrogen metabolism |
| Selected Organic Acids and Carbohydrate-Related Metabolites | 3-Phenyllactic acid, itaconic acid, 2-hydroxyglutaric acid, glycolic acid, glyceric acid, gluconate, glucuronic acid, ureidopropionate, cysteic acid | Extend profiling to selected organic acid and carbohydrate-related metabolites associated with broader metabolic remodeling |
Targeted LC-MS/MS Workflow for Central Carbon Metabolism
Central Carbon Metabolism Data Analysis and Deliverables
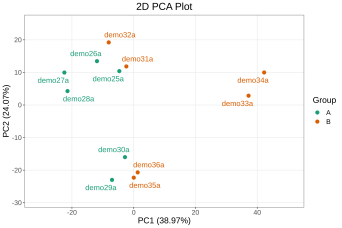
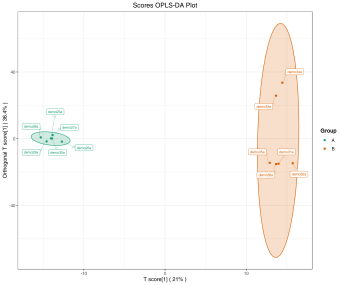
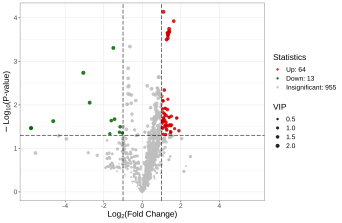
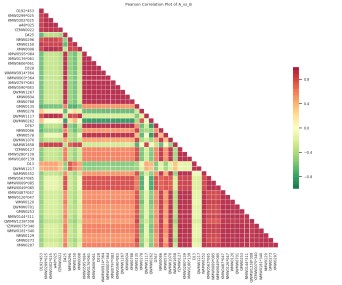
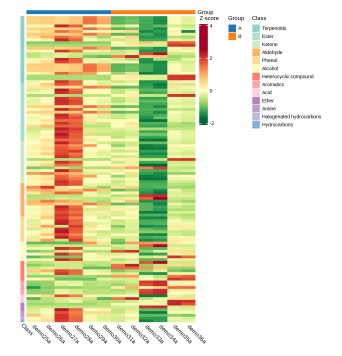
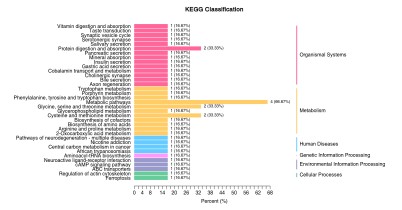
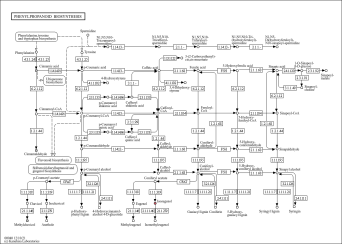
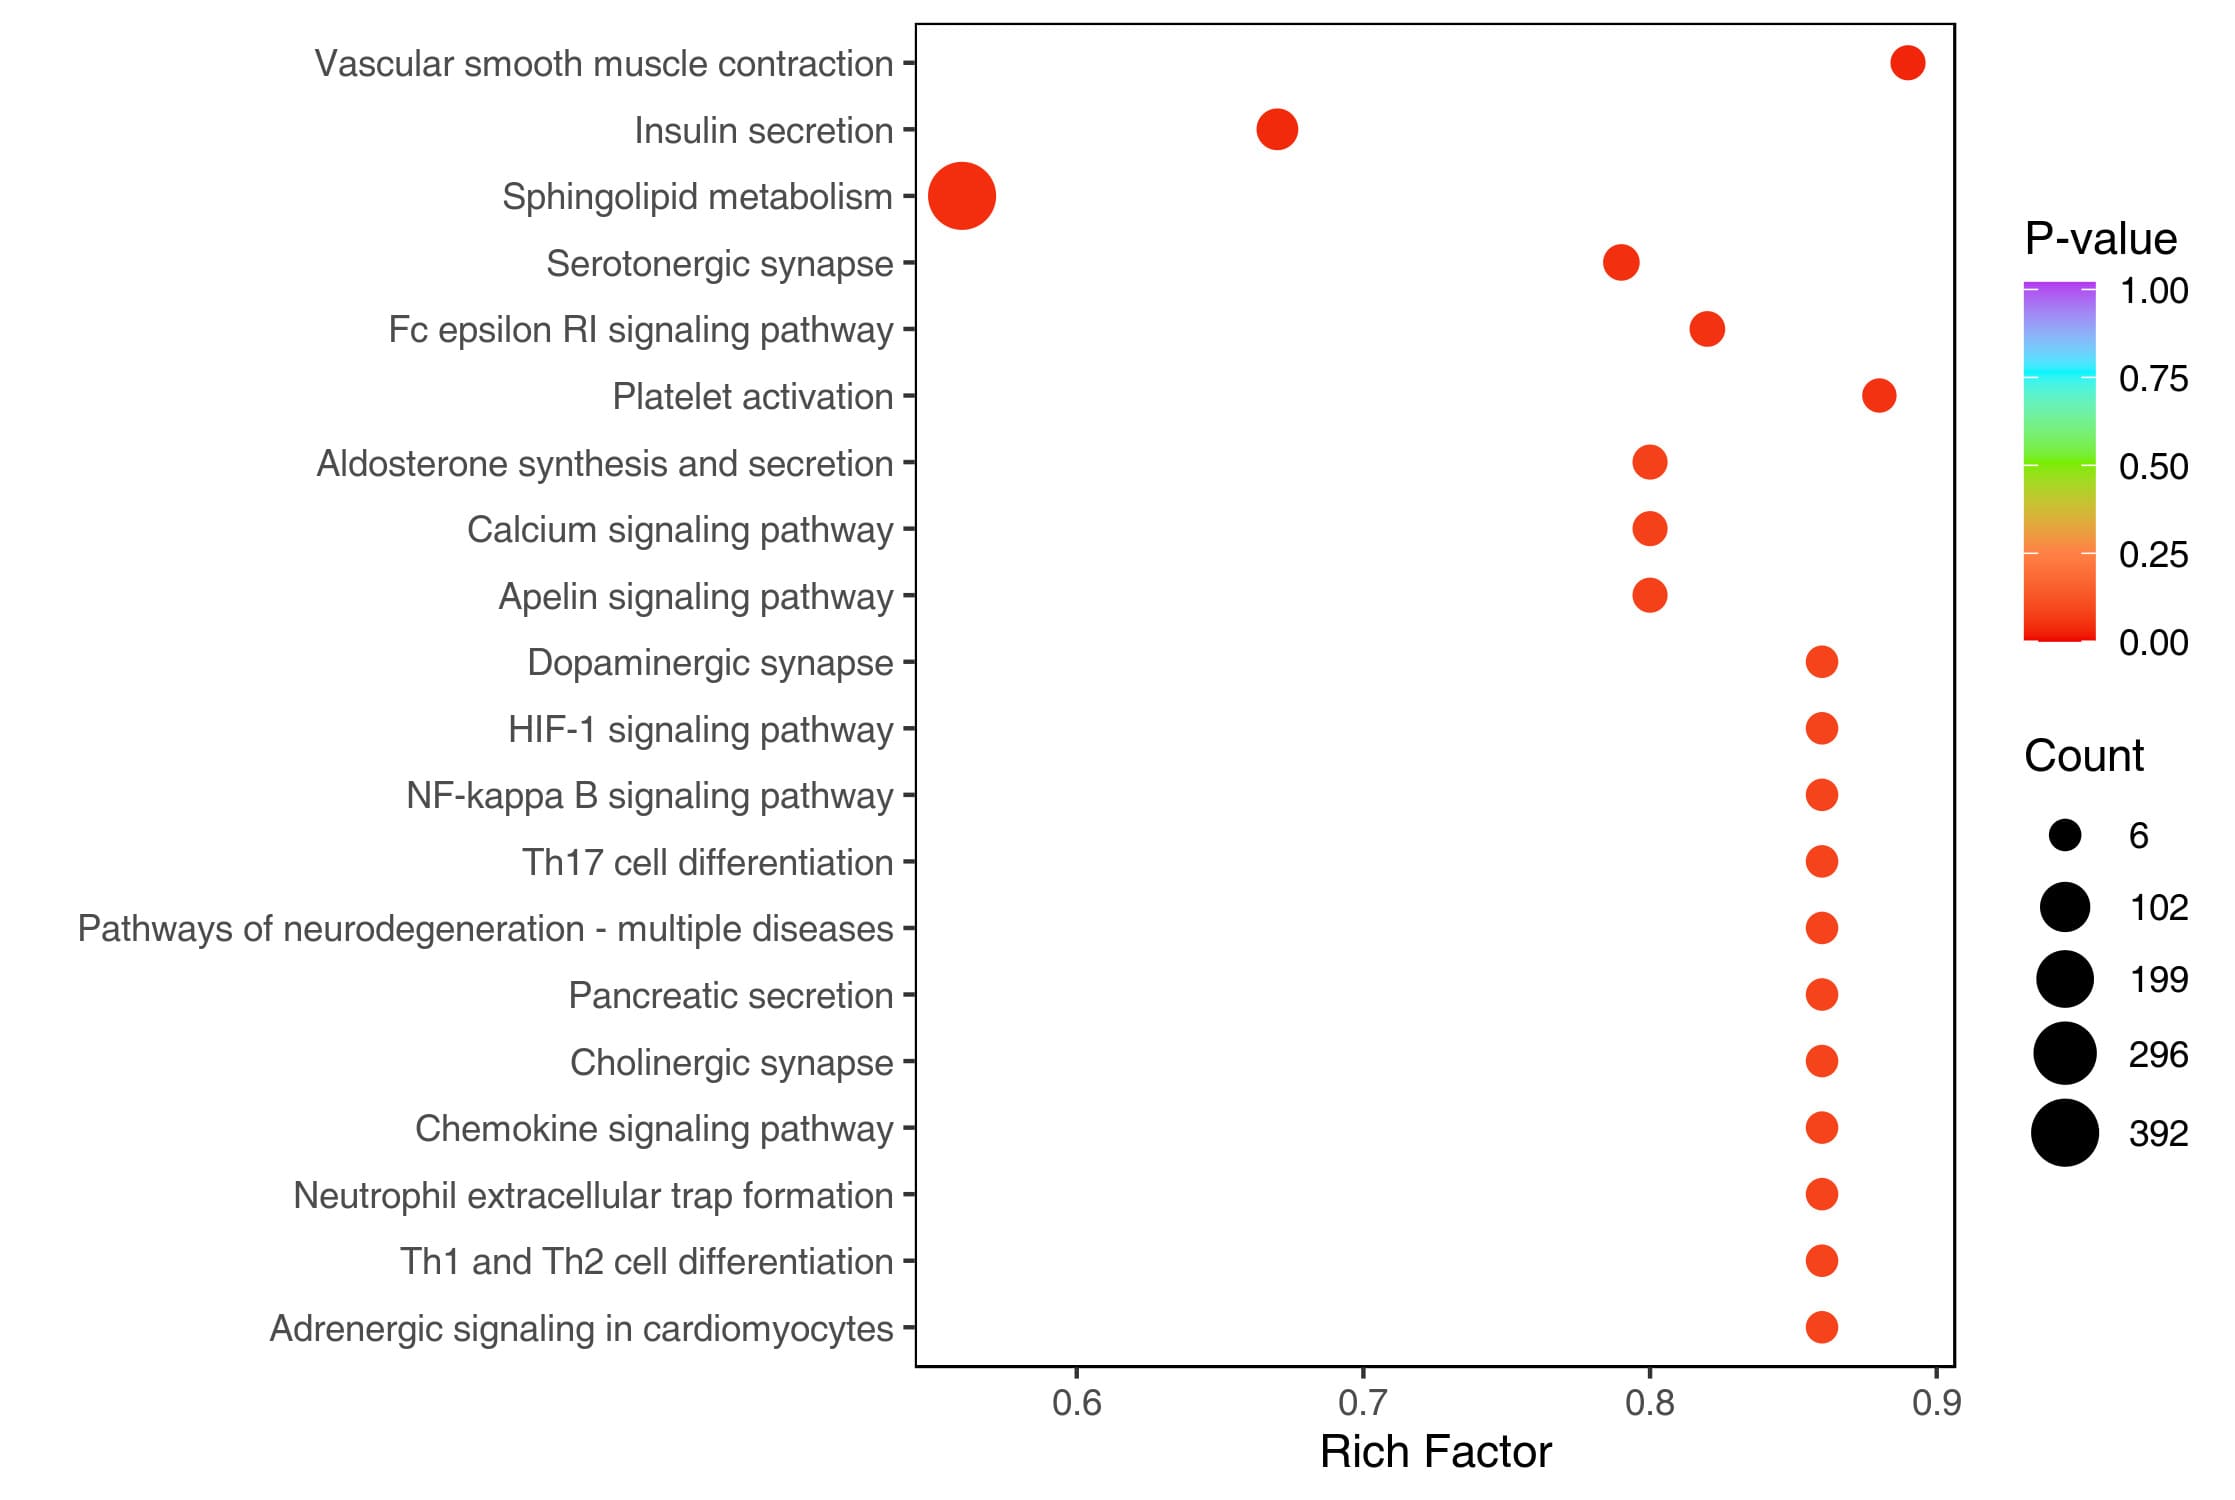
MetwareBio provides complete deliverables for central carbon metabolism targeted metabolomics, including absolute concentration tables, assay calibration information, quality control summaries, differential metabolite analysis, pathway annotation, and a structured project report. These outputs support central carbon metabolism biomarker discovery, pathway validation, mitochondrial function studies, and quantitative comparison across experimental groups. Visualization results may include PCA plots, volcano plots, heatmaps, correlation analysis, bar charts, KEGG pathway annotation, and KEGG enrichment analysis, depending on the number of quantified metabolites, project design, and statistical outcomes. Contact Us for Demo

Project Experience in Central Carbon Metabolism Profiling
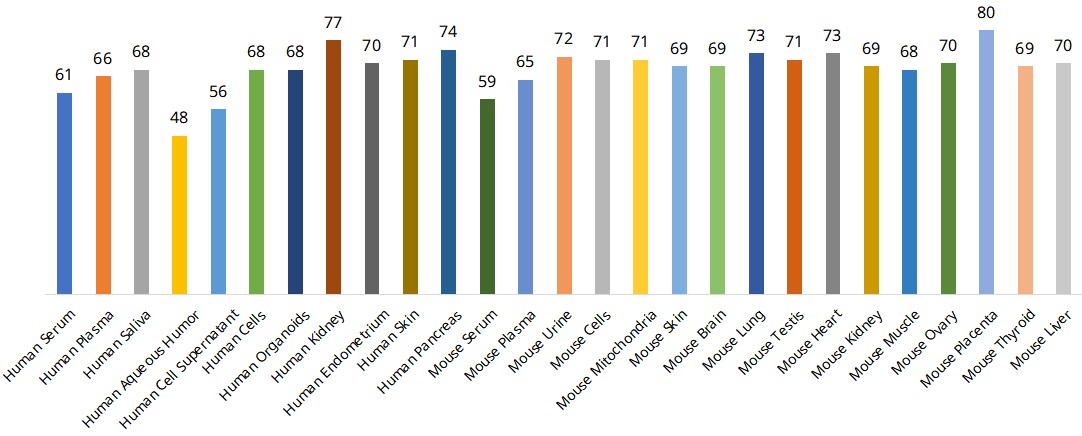
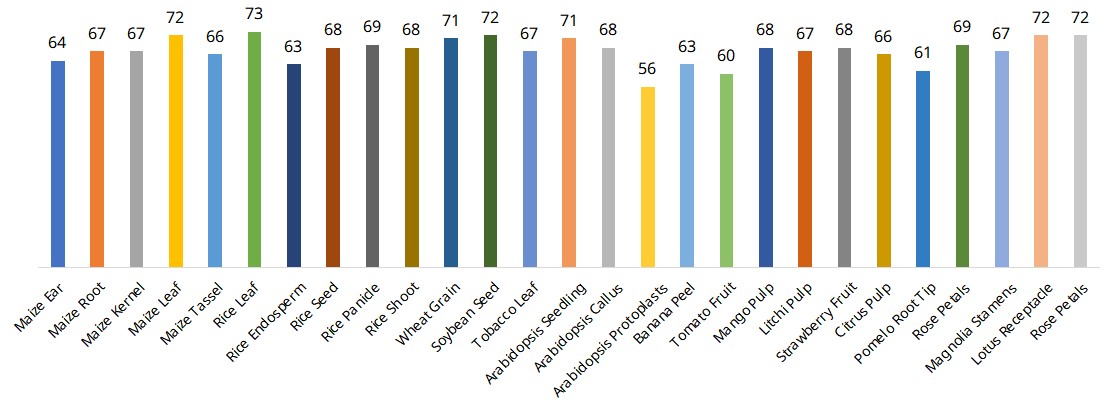
Applications of Central Carbon and Energy Metabolism Analysis
Central carbon metabolism targeted metabolomics is widely used to investigate glycolytic reprogramming, TCA cycle remodeling, oxidative stress, and altered nutrient utilization in cancer. Quantitative profiling of central carbon metabolites helps reveal tumor metabolic vulnerabilities and evaluate treatment-induced metabolic responses.
Altered energy metabolism is closely associated with mitochondrial dysfunction, obesity, diabetes, fatty liver disease, metabolic syndrome, and other disorders involving impaired energy homeostasis. Targeted quantification of glycolysis-, TCA cycle-, PPP-, nucleotide-, and amino acid-linked metabolites supports studies of mitochondrial metabolism, substrate utilization, insulin resistance, and systemic metabolic dysregulation.
Immune cell activation and inflammatory responses are tightly linked to glycolysis, mitochondrial metabolism, PPP activity, and redox regulation. Central carbon metabolism targeted metabolomics helps connect immune phenotypes with central carbon pathway activity and inflammation-associated metabolic remodeling.
Targeted central carbon metabolism profiling can evaluate how drugs, candidate compounds, dietary interventions, environmental factors, or disease models affect cellular and systemic energy pathways. This assay supports preclinical pharmacology, toxicology, nutritional studies, mechanism-of-action research, and intervention response evaluation.
Central carbon metabolism is central to plant growth, stress adaptation, carbon allocation, and cellular respiration. Targeted quantification of glycolysis, TCA cycle, PPP, nucleotide-related, and amino acid-linked energy metabolites supports studies of plant stress responses, crop physiology, nutrient utilization, and agricultural trait regulation.
Central Carbon Metabolism Targeted Metabolomics Case Study
Case Study | Targeted Central Carbon Metabolism Profiling Reveals Gut Microbiota–Energy Metabolism Regulation in Major Depressive Disorder
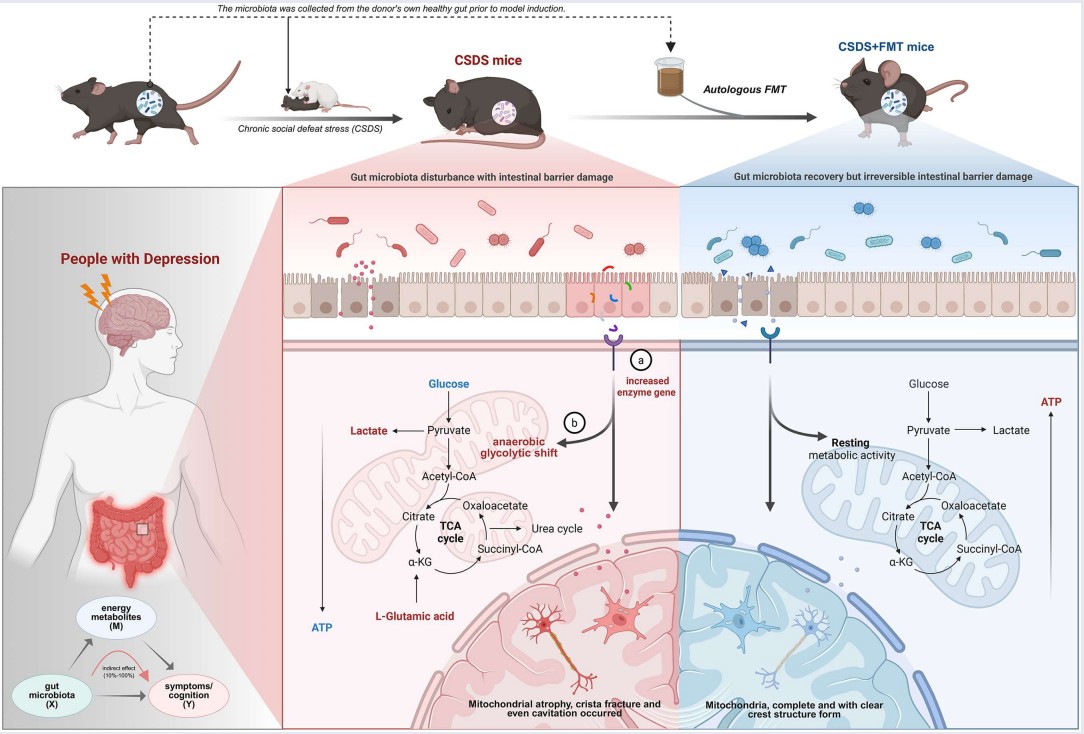
In a Gut Microbes study titled Gut microbiota reshapes host central carbon metabolism to modulate depressive behaviors, researchers integrated targeted metabolomics and shotgun metagenomics using samples from 100 major depressive disorder patients and 68 healthy controls to investigate how gut microbiota reshape host energy metabolism. The study found significant disturbances in central energy pathways, including glycolysis, the TCA cycle, and the ornithine cycle, which were associated with depressive symptoms and cognitive impairment. Targeted central carbon metabolism profiling identified altered metabolites such as lactate, L-glutamic acid, isocitric acid, L-citrulline, cyclic AMP, adenine, ornithine, and AMP, supporting the proposed "gut microbiota–energy metabolites–depressive phenotype" axis. Further validation in a chronic social defeat stress mouse model showed that fecal microbiota transplantation helped reverse stress-induced shifts toward anaerobic glycolysis and restore mitochondrial morphology in brain regions, demonstrating the value of targeted central carbon metabolism metabolomics for studying microbiota–host metabolic regulation, mitochondrial dysfunction, and neuropsychiatric disease mechanisms.
Sample Requirements for Central Carbon Metabolism Analysis
| Sample Class | Sample Type | Recommended Sample Size | Minimum Sample Size |
| Liquid I | Plasma, serum, hemolymph, whole blood, milk, egg white | 100 μL | 20 μL |
| Liquid II | Cerebrospinal fluid (CSF), interstitial fluid (TIF), uterine fluid, pancreatic juice, bile, pleural effusion, follicular fluid, fallopian tube fluid, postmortem fluid, tissue fluid, culture medium (liquid), culture supernatant, fermentation broth, tears, aqueous humor, digestive juices, bone marrow (liquid) | 100 μL | 50 μL |
| Liquid III | Seminal plasma, amniotic fluid, prostatic fluid, rumen fluid, respiratory condensate, gastric lavage fluid, bronchoalveolar lavage fluid (BALF), urine, sweat, saliva, sputum | 500 μL | 50 μL |
| Tissue I | Small animal tissues, placenta, blood clot, mycelium, nematode, zebrafish whole fish, bone marrow solid sample, nail | 100 mg | 50 mg |
| Tissue II | Large animal tissues, whole insect body, insect wings, pupa, eggs, large fungi, large amount of fungal mycelium or mycelial balls, cartilage, bone solid sample | 500 mg | 50 mg |
| Tissue III | Zebrafish organs, insect organs, whole microinsect body such as Drosophila | 20 units | / |
| Tissue IV | Plant Tissue (Root, Stem, Leaf, Fruit, Flower, Bud, Node, Callus, Seed) | 300 mg | 200 mg |
| Solid I | Feces, intestinal contents, lyophilized fecal powder | 200 mg | 50 mg |
| Solid II | Milk powder, microbial fermentation product solid sample, culture medium solid sample, earwax, lyophilized tissue powder, feed, egg yolk powder, lyophilized plant powder, lyophilized egg powder | 100 mg | 50 mg |
| Solid III | Honey, nasal mucus, sputum, fresh egg yolk | 2 g | 500 mg |
| Solid IV | Sludge, soil | 600 mg | 300 mg |
| Cell I | Adherent cells, animal cell lines | 1 × 10⁶ cells | 5 × 10⁵ cells |
| Cell II | E. coli, yeast cells | 1 × 10¹⁰ cells | 5 × 10⁸ cells |
| Cell III | Small amount of fungal mycelial balls or mycelium, cyanobacteria, large amount of bacteria pellet, slime mold, microbial sludge, dried microbial powder | 100 mg | / |
| Organelle I | Lysosomes, mitochondria, endoplasmic reticulum | 4 × 10⁷ cells or 0.2 g tissue |
1 × 10⁷ cells or 0.1 g tissue |
| Organelle II | Exosomes, extracellular vesicles | 2 × 10⁹ particles or 40 μg protein (BCA) |
1 × 10⁹ particles or 20 μg protein (BCA) |
| Special Sample I | Skin tape or patch | 2 pieces | 1 piece |
| Special Sample II | Test strips | 2 pieces | 1 piece |
| Special Sample III | Swab | 1 piece | 1 piece |
- A minimum of 3 biological replicates per group is required. For better statistical power, ≥30 biological replicates per group are recommended for human cohort studies, and 8–10 biological replicates per group are recommended for animal studies.
- Energy metabolites are sensitive to enzymatic activity and metabolic turnover. Fast quenching, consistent sampling time, rapid freezing, and standardized storage are important for reliable targeted metabolomics results.
FAQ on Central Carbon Metabolism Profiling
Central carbon metabolism is the interconnected network of pathways that processes carbon substrates to support cellular energy production, redox balance, and biosynthesis. Its core pathways include glycolysis, the tricarboxylic acid (TCA) cycle, and the pentose phosphate pathway (PPP). These pathways connect glucose utilization with pyruvate metabolism, mitochondrial carbon metabolism, NADPH generation, and the production of metabolic precursors required for cellular growth and function. Quantitative analysis of central carbon metabolites is widely used to investigate metabolic reprogramming, mitochondrial dysfunction, oxidative stress, disease mechanisms, treatment responses, and environmental or physiological adaptation.
MetwareBio's Central Carbon Metabolism Targeted Metabolomics service provides absolute quantification of 80 metabolites, with focused coverage of glycolysis, pyruvate metabolism, the TCA cycle, and the pentose phosphate pathway. The panel also includes energy-related nucleotides, redox cofactors, amino acid-linked metabolites, and organic acids that connect with central carbon and energy metabolism. This integrated coverage allows researchers to characterize coordinated metabolic changes across major carbon-processing pathways rather than evaluating individual metabolites in isolation.
Yes. The 80-metabolite panel measures key intermediates from glycolysis, the TCA cycle, and the pentose phosphate pathway within a unified targeted LC-MS/MS workflow. Representative targets include glucose-6-phosphate, fructose-6-phosphate, pyruvate, lactate, citrate, α-ketoglutarate, succinate, malate, ribose-5-phosphate, sedoheptulose-7-phosphate, and NADPH. Measuring these interconnected pathways together can provide a more comprehensive view of central carbon metabolic remodeling, including changes in glucose utilization, mitochondrial carbon metabolism, redox balance, and biosynthetic precursor availability.
No. Targeted central carbon metabolomics measures steady-state metabolite concentrations, not the rates at which metabolites move through metabolic pathways. Changes in metabolite concentrations can reveal pathway-associated metabolic remodeling, but they should not be interpreted as direct measurements of glycolytic rate, TCA cycle flux, or PPP flux. Direct measurement of carbon flow through metabolic pathways generally requires stable-isotope tracing, such as 13C-labeled substrates, combined with isotope-resolved metabolomics or metabolic flux analysis. The choice between concentration profiling and flux analysis should therefore depend on the biological question being addressed.
Targeted central carbon metabolomics focuses on a predefined set of metabolites and uses optimized LC-MS/MS methods, calibration standards, and compound-specific MRM transitions to provide sensitive and quantitative measurements. It is particularly suitable when the research question centers on glycolysis, the TCA cycle, the PPP, or related energy metabolism pathways. Untargeted metabolomics, in contrast, surveys a much broader range of detectable metabolic features and is generally better suited for discovery-oriented studies. Targeted analysis is therefore preferred when accurate quantification of known pathway metabolites is the primary objective, whereas untargeted metabolomics is more appropriate for broad metabolic discovery.
MetwareBio uses targeted LC-MS/MS in multiple reaction monitoring (MRM) mode, together with compound-specific calibration curves, internal standards, and standardized data processing. Calibration curves convert analytical signal responses into metabolite concentrations, while internal standards help control variation introduced during sample preparation, injection, and instrumental analysis. Quality control samples are incorporated throughout the analytical workflow to monitor signal stability, reproducibility, and batch performance. This approach enables quantitative comparison of central carbon metabolites across biological samples and experimental groups.
Central carbon metabolism can be profiled in a range of compatible biological matrices, including serum, plasma, urine, tissues, cultured cells, plant tissues, and other biological samples. The appropriate sample amount and preparation strategy depend on the matrix and expected metabolite abundance. Because many glycolytic, TCA-cycle, nucleotide, and redox-related metabolites can change rapidly after sampling, experimental groups should be collected and processed under consistent conditions. Researchers are encouraged to confirm sample compatibility and minimum sample requirements before beginning a study.
Rapid and standardized sample handling is critical because many central carbon metabolites are sensitive to ongoing enzymatic activity, ischemia, temperature changes, and processing delays. Samples should be collected consistently, metabolically quenched or frozen as quickly as possible, stored at −80°C, and shipped on dry ice when required. Repeated freeze-thaw cycles and prolonged exposure to room temperature should be avoided. For comparative studies, collection time, fasting status or treatment conditions, processing interval, and storage conditions should be kept as consistent as possible across experimental groups to minimize pre-analytical variation.
Reference
Lei, P., Qi, Z., Ma, Q., Zhao, B., Wen, B., Jiang, W., Xi, W., Liu, Y., Zhang, S., Wang, Y., Guo, Y., Wang, W., Ma, X., Jia, M., & Fan, Y. (2026). Gut microbiota reshapes host energy metabolism to modulate depressive behaviors. Gut Microbes, 18(1), 2662556. https://doi.org/10.1080/19490976.2026.2662556