LIPID MAPS, MS-DIAL, and LipidBlast serve different roles in lipidomics: LIPID MAPS provides lipid structures, classification, and standardized names; MS-DIAL processes experimental mass spectrometry data and supports annotation; and LipidBlast supplies predicted MS/MS reference spectra for candidate matching. This guide explains how to combine these resources and report lipid annotations at the structural level supported by the evidence.
Introduction: The Three Pillars of Lipid Identification
Lipidomics has transformed the study of membrane biology, metabolic regulation, and disease mechanisms. Modern liquid chromatography–tandem mass spectrometry (LC-MS/MS) can detect thousands of lipid-related signals in a single experiment, but converting those signals into defensible lipid annotations remains a major analytical challenge.
Lipid identification involves more than a single database search. LIPID MAPS provides lipid structures and standardized nomenclature, MS-DIAL processes experimental mass spectrometry data and supports annotation, and LipidBlast supplies predicted MS/MS reference spectra for candidate matching. Together, these resources support evidence-based lipid annotation, but a spectral-library match alone cannot confirm a fully resolved molecular structure.
This article explains what each resource does, where its limitations lie, and how to combine them without overstating the certainty of an identification. The same principles apply to exploratory untargeted lipidomics and to method development for more focused assays.
How LIPID MAPS, MS-DIAL, and LipidBlast Work Together
The Lipid Identification Workflow
A useful way to organize an LC-MS/MS study is to separate raw-data processing from library-supported annotation and database-based interpretation. MS-DIAL detects and aligns signals and compares their experimental spectra with compatible libraries; LipidBlast can provide one such predicted library, while LIPID MAPS helps check chemical structures, lipid classes, and reporting nomenclature.
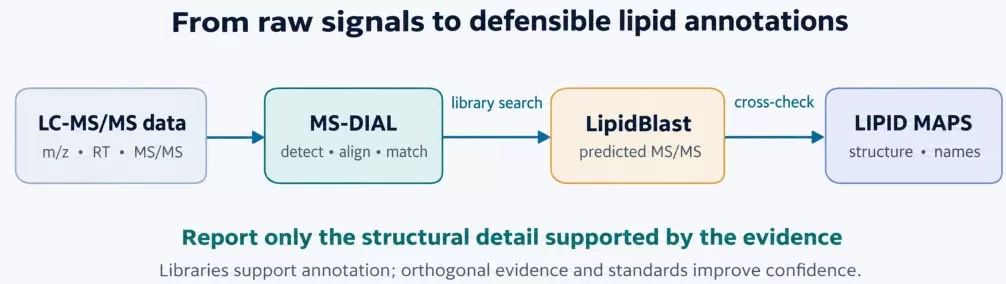
Figure 1. Complementary roles of MS-DIAL, LipidBlast, and LIPID MAPS in an evidence-based lipid annotation workflow. Original illustration.
The workflow is illustrative rather than mandatory: MS-DIAL can also search experimentally acquired libraries, and lipid candidates may be assigned without using LipidBlast. Similarly, LIPID MAPS can support both pre-experiment planning and downstream annotation. In every case, a database entry or spectral match is supporting evidence—not independent proof of an exact isomer.
Why Three Tools?
Lipids are structurally diverse. Two molecules may share the same lipid class, sum composition, or even precursor mass while differing in acyl-chain composition, sn-position, or double-bond location. Accurate-mass measurements often establish only a molecular formula or class-compatible candidate; MS/MS can reveal class-specific head-group fragments and, under suitable conditions, acyl-chain composition; more demanding structural questions may require specialized fragmentation methods, retention-time evidence, ion mobility, or authentic standards. Processing software is therefore needed to extract reliable signals, spectral libraries to generate plausible annotations, and reference databases to standardize structures and biological context. These capabilities are complementary, although the exact combination of tools depends on the research question and analytical platform [1–4].
LIPID MAPS: Lipid Classification, Structures, and Nomenclature
LIPID MAPS (LIPID Metabolites and Pathways Strategy; https://www.lipidmaps.org) is a freely accessible lipidomics resource that combines a structure database with classification, standardized nomenclature, search utilities, and selected analysis resources. It is especially valuable as a reference for deciding what a lipid name means and whether a proposed structure is chemically and taxonomically consistent [1,2].
Lipid Classification System
The LIPID MAPS classification system organizes lipids into eight major categories according to their chemical architecture. Each category is further divided into classes and subclasses, enabling systematic organization across studies [1,2].
| Category | Code | Representative examples |
|---|---|---|
| Fatty acyls | FA | Saturated and unsaturated fatty acids; eicosanoids |
| Glycerolipids | GL | Mono-, di-, and triacylglycerols (MG, DG, TG) |
| Glycerophospholipids | GP | PC, PE, PI, PS, PG, PA, cardiolipin (CL) |
| Sphingolipids | SP | Ceramides (Cer), sphingomyelins (SM), glycosphingolipids |
| Sterol lipids | ST | Cholesterol, cholesteryl esters, bile acids |
| Prenol lipids | PR | Ubiquinones, dolichols, tocopherols |
| Saccharolipids | SL | Acylated sugars and lipid A–related structures |
| Polyketides | PK | Polyketide-derived compounds, including many flavonoids |
Standardized Nomenclature
A key principle of lipid shorthand notation is that the reported name must not imply structural information that the experiment did not resolve. For example, a phosphatidylcholine signal may support a total acyl composition, the identities of its two chains, or their relative positions—but these are not interchangeable levels of confidence [2,3].
| Information established | Illustrative notation | Interpretation |
|---|---|---|
| Lipid category | GP | A glycerophospholipid |
| Lipid class | PC | Phosphatidylcholine class |
| Sum composition / species | PC 34:1 | A total of 34 acyl carbons and one double bond |
| Molecular species | PC 16:0_18:1 | Two acyl chains assigned; sn-positions unresolved |
| sn-resolved structure | PC 16:0/18:1 | Chain positions assigned, where supported |
| Double-bond-resolved structure | PC 16:0/18:1(9Z) | Additional evidence supports the olefin position/geometry |
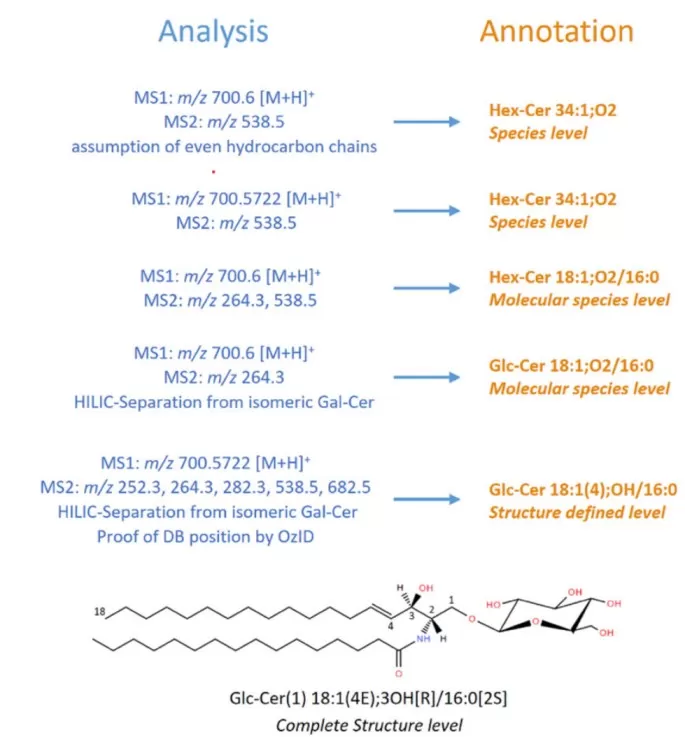
Figure 2. Hierarchical scheme for glucosylceramide identification, illustrating increasing levels of structural detail supported by mass spectrometry evidence. Reproduced from Figure 1 in Liebisch et al. (2020), Journal of Lipid Research. Licensed under CC BY.
In this convention, the underscore indicates that chain positions are not established; the slash is reserved for position-specific assignments. Specialized methods or standards are generally needed before a double-bond-resolved structure can be reported with confidence [2].
Structure Database (LMSD)
The LIPID MAPS Structure Database (LMSD) provides searchable records that may include 2D structures, molecular formulas, calculated masses, accepted names, synonyms, cross-database identifiers, literature, and biological or taxonomic information when available. This makes it a strong starting point for candidate generation and standardized reporting, but the presence of a candidate in LMSD does not establish that it is present in a biological sample [1].
When to Use LIPID MAPS
Use LIPID MAPS to look up a compound’s formula and exact mass, review lipid classification, compare names from different datasets, and explore lipid biology through supported pathway tools. It is also useful during method development when selecting candidate lipid classes and checking theoretical precursor/adduct masses. For study interpretation, its greatest contribution is chemical consistency and standardized reporting rather than direct identification of an unknown feature.
Practical Example
Suppose a plasma LC-MS experiment detects an ion at m/z 760.5851 in positive mode and the adduct assignment is [M+H]⁺. Subtracting the proton mass gives a neutral monoisotopic mass of approximately 759.5778 Da, consistent with the formula C42H82NO8P and a PC 34:1 composition. An LMSD or exact-mass search can produce candidate structures, but exact mass alone cannot distinguish PC 16:0_18:1 from alternative chain combinations such as PC 18:0_16:1, nor can it establish sn-position or the location of the double bond. To narrow the annotation, inspect the MS/MS evidence—for example, the class-related phosphocholine product ion near m/z 184.0733 in positive mode—and use chain-informative fragments or complementary experiments where available [2,4].
Key Tools Within LIPID MAPS
LIPID MAPS provides resources beyond LMSD. LipidFinder supports LC-MS feature filtering and data review; BioPAN supports pathway-oriented interpretation of lipid changes; Goslin 2.0 facilitates automated parsing and harmonization of shorthand lipid names; and LipidLibrarian supports linked searches across lipid resources. Availability and interfaces may evolve, so confirm the relevant version before citing a particular web tool [1,3,7].
MS-DIAL: Lipidomics Data Processing and Annotation
MS-DIAL is free data-processing software developed by the Systems Omics Lab/RIKEN research community for metabolomics and lipidomics. It converts compatible mass spectrometry files into feature tables and supports peak detection, chromatographic alignment, spectral deconvolution, library-based annotation, data normalization, and downstream visualization. It is distinct from LIPID MAPS because it operates on experimental measurements, not primarily on a structure catalogue [4,5].
Universal Data Processing
MS-DIAL supports LC-MS(/MS), GC-MS(/MS), and selected ion-mobility and direct-infusion workflows, with capabilities depending on the software version and acquisition mode. It works with data from major instrument vendors, typically through supported vendor formats or converted formats such as mzML/ABF. DDA, DIA/SWATH, and related all-ion acquisition schemes require different processing settings and should not be assumed to be interchangeable [4].
Spectral Deconvolution
Mass spectral deconvolution helps associate fragment ions with their likely precursor features when chromatographic peaks overlap or when DIA acquisition co-fragments multiple precursors. This is particularly useful for complex lipid mixtures in which related classes elute close together. Correlation-based approaches such as CorrDec can improve the extraction of representative MS/MS spectra across multiple samples, although successful deconvolution still depends on chromatographic quality, acquisition settings, and signal intensity [5].
Lipid Identification
MS-DIAL compares accurate-mass, retention-time, and MS/MS evidence with compatible reference libraries, including experimental MSP spectra and predicted lipid libraries. Its lipidomics workflows also include rule-based characterization and database-supported annotation; version-specific functionality should be checked against the official documentation. Importantly, a high library-matching score is not equivalent to authentication of every structural feature, and retention-time prediction or computed spectra are not universally available for every lipid class and method [4].
Complete Workflow
| Stage | Purpose / deliverable |
|---|---|
| Import and configure | Choose acquisition mode, compatible files, mass tolerances and reference libraries |
| Peak picking | Detect chromatographic features and associated ion signals |
| Deconvolution | Recover interpretable MS/MS evidence, especially in DIA workflows |
| Alignment | Link features across biological samples and pooled QCs |
| Annotation | Search experimental or predicted spectra and apply lipid class rules |
| Quantitative export | Extract relative peak areas with normalization/QC metadata |
| Review and report | Filter unreliable features, inspect spectra, export annotated tables |
When to Use MS-DIAL
Choose MS-DIAL when a study requires consistent LC-MS or GC-MS peak processing across many samples, deconvolution of DIA spectra, cross-sample alignment, and relative comparisons of lipid abundance. Its outputs are suited to exploratory discovery and statistical downstream analysis. Peak areas alone are relative analytical responses, however; concentration measurements require calibration and appropriate internal-standard methodology.
Practical Example: Lipid Identification Workflow
For a DDA plasma lipidomics dataset, begin by importing compatible raw files and setting instrument-appropriate mass and retention-time tolerances. Perform peak picking, inspect representative chromatograms, and align the sample set using QC-based evaluation. Next, load an experimental MSP library, a supported predicted lipid library, or both, and configure precursor/product-ion criteria appropriate for the measurement accuracy and fragmentation method. Finally, review the top hits for important lipids and export the feature matrix with names, adducts, retention times, scores, and supporting spectra.
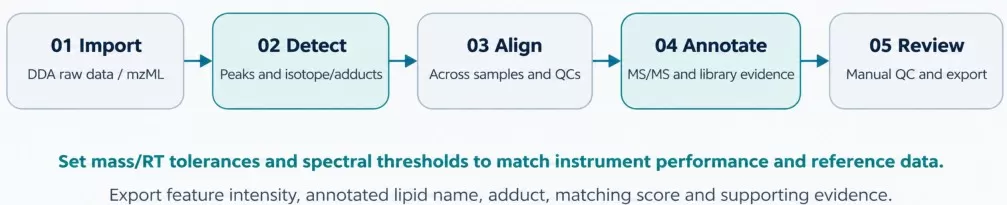
Figure 3. An illustrative five-stage MS-DIAL workflow for a DDA plasma lipidomics experiment. Original illustration.
For a high-resolution Orbitrap study, a 0.01 Da mass tolerance, a 0.5 min retention-time window, or a 70% similarity cutoff may be used as initial exploratory settings in some workflows, but these numbers are not universal recommendations. Tolerances should instead reflect measured mass error, RT stability, collision energy, library type, and the software version. A large spectral library should not be imported solely on the basis of its record count; verify whether its compounds and ionization conditions are relevant to the lipid panel.
MS-DIAL Spectral Libraries
The official MS-DIAL portal provides MSP collections assembled from authentic standards and other sources. The representative counts below are those listed for its metabolomics MSP kit on August 8, 2024; “records” means spectra/entries, not distinct compounds. These collections are not all lipid-specific, and their contents must not be equated with a number of confirmed lipid standards.
| Collection | Unique compounds | Spectral records |
|---|---|---|
| ESI+ MS/MS — authentic standards | 16,232 | 324,191 |
| ESI− MS/MS — authentic standards | 8,887 | 44,669 |
| ESI+ MS/MS — standards + biological + in silico | 16,746 | 326,575 |
| ESI− MS/MS — standards + biological + in silico | 15,100 | 53,337 |
| CCS / additional reference data | Varies | Separate downloads |
Reference library snapshot (August 8, 2024)
Advanced Features
Ion mobility: Compatible workflows can use collision cross section (CCS) information alongside precursor mass, RT, and fragments, providing an additional—though not always unique—dimension for annotation. DIA: MS-DIAL offers deconvolution strategies for multiplexed MS/MS data, including CorrDec, with performance governed by the experimental design and data quality. Isotope tracing: Selected workflows support the analysis of stable-isotope labeling patterns; however, estimating absolute metabolic flux generally requires a suitable tracer design and kinetic or isotopically nonstationary modeling beyond simple feature annotation [4,5].
Limitations
MS-DIAL has a substantial parameter-learning curve and can require considerable computational resources for large datasets. Automated identifications are vulnerable to false positives, incomplete libraries, adduct confusion, and unresolved isomers, so representative chromatograms and diagnostic fragments should always be reviewed. Features without useful library matches may remain unknown; orthogonal measurements or other structure-elucidation methods may be needed.
LipidBlast: Predicted MS/MS Spectral Library for Lipid Identification
LipidBlast is a computationally generated tandem mass spectral library designed to broaden lipid annotation beyond the limited availability of authentic standards. Rather than measuring every compound experimentally, its developers encoded lipid fragmentation chemistry to generate spectra for many candidate structures and adducts. The original 2013 release described more than 200,000 predicted spectra representing approximately 119,000 compounds across 26 lipid classes; coverage in any installed library depends on the version and files used [6].
Its central workflow is straightforward: candidate lipid structures are represented in a predicted MS/MS library, experimental tandem spectra are searched against those entries using compatible software, and candidate matches are evaluated together with precursor mass, lipid-class fragments, adduct behavior, and chromatographic plausibility. LipidBlast is a reference resource, not a raw-data processing platform.
Key Features
1. Broad Predicted Coverage
Predicted spectra cover many common lipid subclasses, including phospholipids, glycerolipids, and selected glycolipid and sphingolipid classes, with multiple ionization modes or adducts represented where supported. This breadth is particularly valuable when authentic standards are unavailable, but it does not imply complete coverage of every lipid category or every unusual modification. [6]
2. Precursor and Fragment Matching
LipidBlast supports candidate generation through agreement between the experimental precursor and a theoretically modeled fragment pattern. Class-diagnostic ions and acyl-chain-related fragments may be informative, but the quality of a match depends on the experimental collision regime and spectral characteristics. Isotope distributions can provide independent formula-level checks in the overall workflow; they should not be described as a unique LipidBlast identification algorithm.
3. Integration with Analysis Software
LipidBlast libraries can be searched in software that supports their spectral format, such as MS-DIAL where a compatible MSP file and appropriate processing mode are available. Library file format, adduct syntax, polarity, and collision-energy assumptions should be checked before importing a database compiled for a different software version or instrument.
LipidBlast vs. Experimental Libraries
| Dimension | LipidBlast / predicted spectra | Experimental standards library |
|---|---|---|
| Coverage | Often broad within supported modeled classes | Limited by acquired standards and conditions |
| Spectral fidelity | Depends on rule coverage and collision regime | Directly measured but instrument/energy-dependent |
| Retention time | Not inherently established by predicted MS/MS | Can be supplied for a specific LC method |
| Best application | Candidate discovery and expanded annotation | Higher-confidence matching under comparable conditions |
| Key limitation | Prediction and isomer ambiguity | Restricted compound and method coverage |
Limitations
Because the spectra are predicted, certain fragment intensities or pathways may differ from those observed in a given instrument. LipidBlast generally does not provide method-specific retention times, and routine MS/MS may not resolve sn-position, double-bond position, stereochemistry, or every regioisomer. A matching engine is needed to compare an experimental spectrum against the library; independent structural verification remains necessary for high-confidence claims [6].
LIPID MAPS vs MS-DIAL vs LipidBlast: Key Differences
Functional Comparison
| Aspect | LIPID MAPS | MS-DIAL | LipidBlast |
|---|---|---|---|
| Primary role | Structure, names, classification | Raw-data processing and annotation | Predicted MS/MS reference |
| Main input | Name, mass, formula or structure | MS raw/converted data | Candidate structures (library creation); experimental spectra queried in software |
| Main output | Chemical/context information | Aligned features and annotations | Predicted spectral entries |
| Peak detection / alignment | Not its primary role | Yes | No |
| Spectrum matching | Selected related resources | Yes, with a compatible library | A library, not the search engine |
| Pathway context | BioPAN and related tools | Primarily exported/downstream | No |
| Main limitation | A candidate is not confirmation | Automated errors and unresolved isomers | Prediction uncertainty |
| Access | Public web resource | Free research software | Freely available reference resource |
Analogy: The Lipid Identification Toolkit
Think of the three resources as components of a laboratory reference workflow: LIPID MAPS is the nomenclature and structure handbook, MS-DIAL is the workbench that processes experimental measurements, and LipidBlast is one of the spectral reference catalogues on that workbench. Together they create a more interpretable result, but they are not exclusive or universally required: experimental libraries, additional software, and targeted validation can be substituted or added according to the question.
When to Use Each Tool
| Research task | Most useful resource(s) |
|---|---|
| Check a lipid formula, exact mass or standardized name | LIPID MAPS; Goslin for nomenclature harmonization |
| Process LC-MS or GC-MS raw data | MS-DIAL |
| Deconvolve DIA/MS2 signals | MS-DIAL (appropriate DIA workflow) |
| Expand MS/MS annotation candidates | MS-DIAL + LipidBlast or another compatible library |
| Compare relative lipid abundance across samples | MS-DIAL feature areas + QC/normalization |
| Explore lipid pathway context | LIPID MAPS BioPAN / other biological tools |
| Resolve challenging positional isomers | Specialized MS methods and/or authentic standards |
| Validate a high-priority candidate | Matched reference standard and orthogonal evidence |
Using These Tools for Targeted Lipid Quantification
Research question: What are the absolute concentrations of selected lipid species in plasma? In this case, first define the target lipid structures and select chromatographically specific precursor/product-ion transitions for LC-MS/MS in multiple reaction monitoring (MRM) mode. Use authentic calibrators and, where feasible, stable-isotope-labeled internal standards, with a calibration strategy appropriate to the matrix. Next, acquire validation data to establish selectivity, sensitivity, linearity, accuracy, precision, recovery, and matrix effects. Quantitative peak integration and calibration are typically performed in validated vendor or targeted-assay software, while LIPID MAPS supports structure and theoretical-mass checks.
LipidBlast plays a secondary role in targeted assays because the analytes, transitions, and reference compounds are already defined. A database lookup cannot confirm transition specificity or replace standards. When authentic standards are scarce, reporting should distinguish full analyte-specific absolute quantification from class-equivalent or semi-quantitative estimates that use representative internal standards.
Other Best Practices
Before acquisition, use structural references to define relevant lipid classes and adducts. During processing, include pooled QC samples, blanks, and consistent acceptance criteria; search libraries with the correct polarity and fragmentation settings; and check key identifications manually. For publication or client reporting, provide the software and library versions, mass tolerances, diagnostic ions, RT/CCS evidence where applicable, normalization approach, and the highest structural level actually supported [2,4].
Common Lipid Identification Pitfalls and How to Avoid Them
The most frequent lipidomics errors arise when a top-scoring software hit is treated as proof of a complete molecular structure, when inconsistent naming conventions conceal differences between datasets, when predicted and experimental spectra are used interchangeably without checking polarity or collision conditions, or when inadequate QC allows instrumental drift and batch artifacts to enter biological interpretation. To avoid these problems, inspect diagnostic fragment ions and adduct assignments, use LIPID MAPS/Goslin-compatible names, report unresolved chains or double bonds at an appropriately conservative structural level, compare libraries under suitable acquisition conditions, and validate important conclusions with authentic standards or orthogonal methods whenever possible. Pooled QCs, blanks, retention-time stability, and reproducibility metrics should be reviewed before differential analysis [2–6].
Identification confidence should be expressed in two complementary ways: the quality of the evidence (for example, authentic-standard confirmation versus library-supported annotation) and the structural detail justified by that evidence. Generic small-molecule “Level 1–4” labels alone do not reliably communicate lipid-specific isomer resolution [2].
Summary: Your Lipid Identification Toolkit
Quick Reference Table
| Resource | Core function | Best use | Principal strength |
|---|---|---|---|
| LIPID MAPS | Structure, nomenclature, taxonomy | Chemical lookup and interpretation | Standardized lipid reference framework |
| MS-DIAL | Peak processing and spectral matching | Raw-data analysis and relative profiling | Integrated feature-processing workflow |
| LipidBlast | Computational MS/MS spectra | Broader candidate lipid annotation | Coverage beyond measured standards |
Useful Official Resources
| Resource | Primary purpose |
|---|---|
| LIPID MAPS | Lipid database, classification, names, BioPAN |
| MS-DIAL | Software, reference libraries, and tutorials |
| MS-DIAL releases | Version information and updates |
| Goslin | Lipid nomenclature parsing and harmonization |
| LipidBlast paper | Original predicted-library methodology |
The practical distinction is simple: LIPID MAPS tells you how a lipid is structured and named, MS-DIAL extracts and organizes the evidence in your experimental data, and LipidBlast helps expand the candidate space through predicted fragments. They work best as complementary components of an evidence-driven workflow—not as substitutes for instrument QC, careful interpretation, or standards-based validation.
Plan Your Lipidomics Study with MetwareBio
Reliable lipidomics requires consistent sample preparation, appropriate analytical methods, and lipid annotations supported by experimental evidence. MetwareBio's Quantitative Lipidomics service provides UPLC-MS/MS-based profiling of 4,000+ lipid species across 51 classes, using optimized MRM detection and class-specific internal standards for semi-quantitative analysis. Our workflow includes quality control, differential lipid analysis, and downstream bioinformatics to support studies of lipid metabolism and remodeling. Contact our team to discuss your samples, research objectives, and lipidomics requirements.
Explore Quantitative Lipidomics ServicesRead More: Lipidomics Databases, Workflows, and Analysis
LIPID MAPS, MS-DIAL, and LipidBlast sit inside a broader lipidomics toolkit of databases, extraction methods, and data-analysis workflows. These related articles expand on the resources and practical decisions behind reliable lipid identification and quantification.
A broader survey of the lipidomics tool landscape beyond the three resources covered here, including SwissLipids, LipidFinder, and LipidMatch, with guidance on choosing tools.
Deepens the nomenclature section of this article with worked examples for fatty acids, triacylglycerols, and glycerophospholipid shorthand names.
Connects the annotation confidence levels discussed here to study design: when broad untargeted profiling generates candidates and when targeted assays verify them.
Annotation quality depends on the data feeding it. Compare the two dominant lipid extraction methods and their impact on LC–MS data quality.
Shows how GC-MS and LC-MS/MS platform choices determine which structural questions, such as double-bond position, can be resolved for fatty acids.
An application-domain companion: how plant lipid classes are profiled and interpreted using the same identification principles described here.
References
- [1] Conroy MJ, Andrews RM, Andrews S, Cockayne L, Dennis EA, Fahy E, Gaud C, Griffiths WJ, Jukes G, Kolchin M, Mendivelso K, Lopez-Clavijo AF, Ready C, Subramaniam S, O'Donnell VB. LIPID MAPS: update to databases and tools for the lipidomics community. Nucleic Acids Res. 2024 Jan 5;52(D1):D1677-D1682. doi: 10.1093/nar/gkad896.
- [2] Liebisch G, Fahy E, Aoki J, Dennis EA, Durand T, Ejsing CS, Fedorova M, Feussner I, Griffiths WJ, Köfeler H, Merrill AH Jr, Murphy RC, O'Donnell VB, Oskolkova O, Subramaniam S, Wakelam MJO, Spener F. Update on LIPID MAPS classification, nomenclature, and shorthand notation for MS-derived lipid structures. J Lipid Res. 2020 Dec;61(12):1539-1555. doi: 10.1194/jlr.S120001025.
- [3] Kopczynski D, Hoffmann N, Peng B, Liebisch G, Spener F, Ahrends R. Goslin 2.0 Implements the Recent Lipid Shorthand Nomenclature for MS-Derived Lipid Structures. Anal Chem. 2022 Apr 26;94(16):6097-6101. doi: 10.1021/acs.analchem.1c05430.
- [4] Tsugawa H, Ikeda K, Takahashi M, Satoh A, Mori Y, Uchino H, Okahashi N, Yamada Y, Tada I, Bonini P, Higashi Y, Okazaki Y, Zhou Z, Zhu ZJ, Koelmel J, Cajka T, Fiehn O, Saito K, Arita M, Arita M. A lipidome atlas in MS-DIAL 4. Nat Biotechnol. 2020 Oct;38(10):1159-1163. doi: 10.1038/s41587-020-0531-2.
- [5] Tada I, Chaleckis R, Tsugawa H, Meister I, Zhang P, Lazarinis N, Dahlén B, Wheelock CE, Arita M. Correlation-Based Deconvolution (CorrDec) To Generate High-Quality MS2 Spectra from Data-Independent Acquisition in Multisample Studies. Anal Chem. 2020 Aug 18;92(16):11310-11317. doi: 10.1021/acs.analchem.0c01980.
- [6] Kind T, Liu KH, Lee DY, DeFelice B, Meissen JK, Fiehn O. LipidBlast in silico tandem mass spectrometry database for lipid identification. Nat Methods. 2013 Aug;10(8):755-8. doi: 10.1038/nmeth.2551.
- [7] Fahy E, Alvarez-Jarreta J, Brasher CJ, Nguyen A, Hawksworth JI, Rodrigues P, Meckelmann S, Allen SM, O'Donnell VB. LipidFinder on LIPID MAPS: peak filtering, MS searching and statistical analysis for lipidomics. Bioinformatics. 2019 Feb 15;35(4):685-687. doi: 10.1093/bioinformatics/bty679.