Omics network analysis moves beyond lists of differentially abundant molecules to investigate relationships among genes, proteins, and metabolites. Correlation and co-expression networks often begin with correlations across samples, but they differ in analytical emphasis: pairwise networks describe associations between individual features, whereas co-expression analysis organizes features into coordinated modules and examines how those modules relate to biological traits [1].
Correlation and Co-Expression Networks: Different Analytical Questions
These approaches are complementary rather than mathematically unrelated. The appropriate method depends on whether the aim is to study gene–metabolite links, coordinated transcriptional programs, differences between conditions, or phenotype-associated modules. Neither method by itself establishes causality or proves a physical interaction.
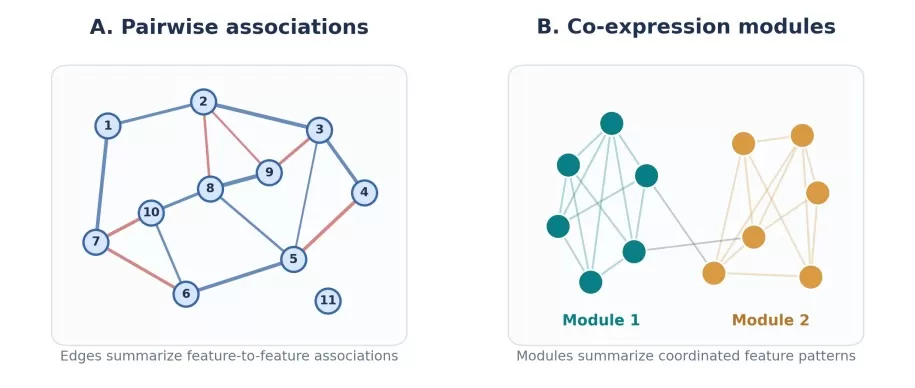
Figure 1. Conceptual distinction between a pairwise association network and a module-centered co-expression network.
Correlation Networks in Omics: Pairwise Molecular Associations
A correlation network represents molecular features as nodes and statistical associations as edges. In a metabolomics study, for example, an edge could connect two metabolites whose relative abundances covary across samples; in multi-omics research, it might connect a transcript and a protein or metabolite measured in the same individuals. An edge can encode association strength and direction, while filtering rules determine which relationships are displayed. Although binary networks are common, correlation networks can also retain continuous edge weights.
Pearson correlation quantifies linear association, with coefficients ranging from −1 to +1. Spearman correlation instead measures rank-based monotonic association and can be more robust to skewed distributions or moderate outliers, although neither measure is immune to confounding. Both are marginal measures: a strong relationship may arise because two molecules respond to the same treatment, belong to different cellular populations, or share an unmeasured upstream driver. Consequently, these edges should be interpreted as statistical associations rather than direct biological interactions.
Partial correlation estimates the association between two features after conditioning on selected other variables. Under suitable modeling assumptions, it can help distinguish associations that remain after accounting for measured covariates or other features. However, a nonzero partial correlation does not establish direct regulation or causality, and conditioning on inappropriate variables may introduce bias. High-dimensional omics datasets, in which the number of features substantially exceeds the number of samples, typically require regularized estimation and careful model selection; PCGII is one example of an approach developed for this setting [3].
Correlation networks are especially valuable for metabolite–metabolite analysis, exploratory proteomics, biomarker hypothesis generation, and cross-platform integration. They are relatively easy to construct, and selected edges can be examined against known biochemical pathways or validated in an independent cohort. Metabolomics-focused tools such as CorrelationCalculator and Filigree support data-driven network analysis [4]. Their principal limitations are sensitivity to sample composition, outliers, batch effects, missingness, correlation thresholds, and multiple testing. For relative or compositional measurements, conventional correlations may also be distorted by normalization and dependence among measured proportions. Network density and apparent biological meaning should therefore be evaluated through sensitivity analyses rather than a single arbitrary cutoff.
Co-Expression Networks: WGCNA and Module Discovery
Co-expression networks investigate how groups of molecular features vary together across a set of samples, conditions, tissues, or time points. Although the term is most commonly associated with gene expression, related module-based approaches can be applied to other continuous omics measurements when their statistical properties are appropriate. The key analytical output is often a module: a group of features with relatively similar patterns that may reflect shared regulation, cell-type composition, or biological function. Module membership provides a starting hypothesis, not definitive evidence that all members belong to one pathway.
Weighted Gene Co-expression Network Analysis (WGCNA) is a widely adopted framework for this purpose [1]. Instead of converting every correlation to a simple present-or-absent edge, WGCNA transforms correlations into weighted adjacency values. For an unsigned network, the conventional expression is aᵢⱼ = |cor(xᵢ, xⱼ)|ᵝ, where β is the soft-thresholding power; signed networks use a different transformation that preserves the distinction between positive and negative correlation. The power is selected by examining connectivity and network-topology diagnostics, not by assuming that a single scale-free fit cutoff is universally valid.
WGCNA commonly uses topological overlap to incorporate the extent to which two features share network neighbors, followed by hierarchical clustering and module detection. Each module can be represented by an eigengene, typically the first principal component of its members’ expression profiles. Researchers can then test module–trait associations, perform pathway enrichment, identify highly connected candidate hub features, and assess whether modules are preserved in independent datasets or experimental conditions [1,2]. Importantly, topological overlap summarizes neighborhood similarity; it does not adjust for confounding, prove functional regulation, or guarantee that inferred hubs are causal drivers.
This module-centered strategy is useful when the primary goal is to identify coordinated biological programs, prioritize features within phenotype-associated modules, or compare network organization across conditions. It is sensitive, however, to sample heterogeneity, gene filtering, data transformation, soft-threshold selection, module-detection parameters, and sample size. Large feature matrices increase memory and computation requirements, but a fixed limit such as 20,000 genes is not a universal boundary; filtering and blockwise workflows can improve scalability. For complex designs, multiWGCNA supports condition-specific networks and module comparisons [6], while hdWGCNA extends the approach to high-dimensional and single-cell transcriptomics, where aggregation or other strategies are particularly important for handling sparse data [7].
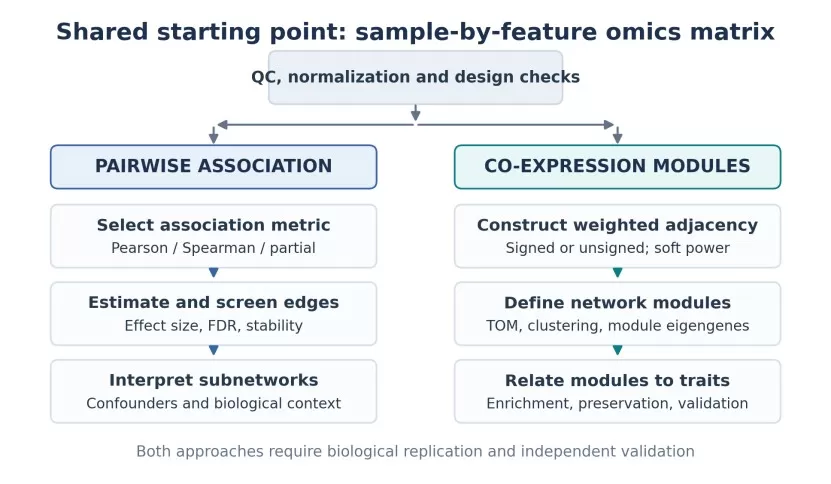
Figure 2. Recommended analysis routes. Both begin with careful quality control but differ in whether the primary result is a set of feature-level associations or module-level biological programs.
Correlation vs. Co-Expression Networks: Key Differences
The most useful distinction is analytical purpose, not a strict separation between two network families. Co-expression networks are frequently constructed from correlations, and a correlation network may itself contain communities or modules. Table 1 compares typical workflows rather than imposing absolute methodological rules.
Table 1. Practical differences between correlation and co-expression networks
| Dimension | Correlation networks | Co-expression networks |
|---|---|---|
| Primary question | Which pairs of molecular features are associated? | Which sets of features show coordinated patterns? |
| Typical data | Metabolomics, proteomics, transcriptomics, or paired multi-omics profiles | Primarily gene expression; adaptable to suitable other omics data |
| Core statistical basis | Pearson, Spearman, partial correlation, or related association measures | Correlation-derived weighted adjacency, often followed by TOM and clustering |
| Network representation | Thresholded binary or continuously weighted edges | Usually weighted networks with explicitly defined modules |
| Confounding | Requires design-aware adjustment; partial correlation can condition on measured variables | TOM is not a confounder adjustment; preprocessing and covariate handling remain essential |
| Topology | No universal topology requirement | Scale-free diagnostics may guide β selection; fit is not guaranteed or mandatory |
| Main output | Individual edges, subnetworks, and candidate cross-omics links | Modules, eigengenes, intramodular connectivity, and trait associations |
| Interpretation | Association does not imply direct physical interaction or causality | Coordinated variation does not establish common regulation or causal hubs |
| Computational profile | Ordinary correlations are comparatively simple; high-dimensional partial models can be costly | TOM and module detection can be memory intensive; blockwise options help |
| Validation | Edge stability, FDR control, covariate sensitivity, independent replication | Module robustness, preservation, enrichment, and independent replication |
When to Use Correlation or Co-Expression Networks
Use correlation networks when your research question centers on specific relationships among analytes. They provide an intuitive route from measured features to interpretable edges, making them well suited to exploratory metabolomics, targeted questions in proteomics, and gene–metabolite or protein–metabolite association studies. The central advantage is flexibility: pairwise associations can span data modalities as long as samples are aligned, transformations are appropriate, and technical or biological confounders are addressed. Conditional models may refine candidate relationships, but causal claims still require orthogonal evidence [3–5].
Use co-expression networks when the objective is to discover coordinated gene programs or reduce thousands of features to a smaller number of biologically interpretable modules. WGCNA-like workflows are particularly helpful for connecting module-level patterns to disease status, continuous phenotypes, developmental stages, or treatment responses. Module eigengenes simplify downstream modeling, while enrichment, connectivity, and preservation analyses can help prioritize hypotheses. Their benefits depend on adequate biological variation, an appropriate experimental design, and external validation [1,2,6,7].
Table 2. Research goals and recommended approaches
| Research objective | Preferred starting point | Practical rationale |
|---|---|---|
| Explore associations among metabolites | Correlation network | Interpret pairwise metabolite patterns; inspect pathway context and sample-specific artifacts. |
| Connect genes, proteins, and metabolites | Cross-omics correlation or supervised integration | Supports edges between matched omics layers; multivariate approaches such as SmCCNet 2.0 may incorporate a phenotype [5]. |
| Find coordinated gene programs | WGCNA / related module discovery | Organizes expression features into modules that can be summarized and annotated [1]. |
| Associate molecular programs with a clinical trait | Co-expression modules plus trait modeling | Tests module eigengenes against covariate-adjusted outcomes; replicate prioritized signatures. |
| Compare time points, tissues, or conditions | Condition-specific networks and module preservation | Distinguishes changes in module activity from changes in underlying connectivity [2,6]. |
| Analyze single-cell transcriptional states | Single-cell-adapted module analysis | Use cell-type-aware processing and approaches such as hdWGCNA to address sparsity [7]. |
| Study both pairwise links and pathways | Hybrid network strategy | Identify within-layer modules, then evaluate cross-module and cross-omics connections [5]. |
Practical recommendations - Build networks that can be trusted
Start with the experimental design and data quality
Before network construction, verify sample identifiers across data modalities, check missing-value patterns, inspect outliers, and account for batch, treatment, sex, age, tissue composition, or other plausible covariates. Apply data-type-appropriate normalization and transformation; for RNA-seq, raw counts should generally not be used directly in ordinary correlation analysis. In heterogeneous cohorts, pooled associations may be driven largely by differences between groups, even when within-group relationships are weak or reversed. Inspect stratified results when the study design suggests that this could occur.
Match the statistical method to the question
For exploratory pairwise networks, choose Pearson when approximately linear relationships are plausible and use Spearman when monotonic rank associations are a better fit. Consider partial correlation or regularized graphical modeling when conditional associations are of interest, while recognizing the additional assumptions and instability possible in high-dimensional data [3]. Report effect sizes alongside statistical significance, control the false discovery rate where appropriate, and evaluate edge stability by resampling or independent replication. For WGCNA, document whether the network is signed or unsigned, assess the chosen soft-thresholding power against several diagnostics, filter uninformative features, and examine module robustness rather than relying on a single scale-free fit statistic [1].
Connect network findings to biology without overclaiming
Biological interpretation should integrate enrichment analysis, known pathway relationships, relevant literature, and independent measurements. A high-connectivity hub is a useful prioritization candidate, not automatically a master regulator or biomarker. Similarly, a metabolite pair connected by a strong edge may share a response to an unmeasured process rather than a direct biochemical reaction. Where possible, validate key edges or modules in a separate cohort, targeted assay, genetic perturbation, or functional experiment. Cross-condition studies should distinguish shifts in module expression from changes in intramodular connectivity, using preservation statistics when appropriate [2].
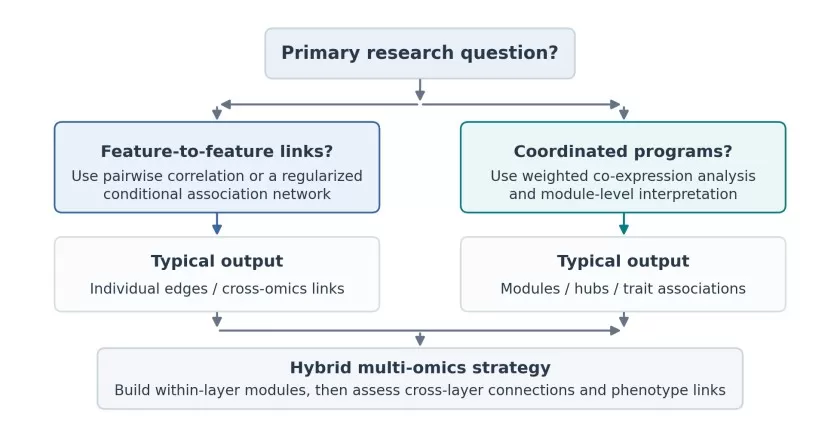
Figure 3. A decision guide for choosing pairwise, module-based, or hybrid network analysis according to the biological question.
Integrating Correlation and Co-Expression in Multi-Omics Studies
Multi-omics studies often benefit from combining the two perspectives rather than selecting only one. Researchers may first identify stable transcriptomic or proteomic modules within each data layer and then correlate their summary profiles with metabolites, phenotypes, or modules from other layers. Alternatively, cross-omics feature-level associations can reveal candidate connections that a single-layer analysis would miss. SmCCNet 2.0 illustrates how phenotype-associated multi-omics networks can be modeled jointly, rather than relying exclusively on separate pairwise tests [5].
These integrations require particular care because the data layers differ in dynamic range, missingness, detection limits, and biological coverage. Analyses should use matched samples, document which features were filtered or imputed, consider the effect of cell-type composition, and distinguish exploratory associations from validated mechanistic links. When feasible, results should be replicated across cohorts or assessed for stability under alternative normalizations and feature-selection choices.
Conclusion
Correlation networks and co-expression networks answer related but distinct questions. Pairwise networks are most effective when individual molecular relationships or cross-omics links are central to the hypothesis. Co-expression frameworks such as WGCNA add value when the aim is to discover coordinated modules, relate them to traits, and examine their preservation across biological contexts. Because co-expression methods often begin with correlations, the methods should be viewed as complementary levels of network analysis rather than competing mathematical paradigms.
A reliable workflow begins with a clearly defined biological question, appropriate preprocessing, and a defensible statistical method. It ends with careful uncertainty assessment, biological interpretation, and external validation. In practice, the strongest omics insights often emerge by using pairwise associations to generate focused hypotheses and module-level analysis to place those relationships in a broader biological context.
Plan Your Multi-Omics Analysis with MetwareBio
Planning a study that connects genes, proteins, metabolites, or biological traits? MetwareBio provides integrated multi-omics solutions combining transcriptomics, proteomics, metabolomics, and bioinformatics analysis. Our team can help evaluate matched-sample design, data quality, and analytical objectives to determine whether pairwise correlation, co-expression modules, or complementary integration methods are appropriate. Contact us to discuss your research questions, sample types, and a multi-omics analysis strategy aligned with your study.
Discuss Your Multi-Omics ProjectRead More: Omics Statistical and Network Analysis
Correlation and co-expression networks are two of many statistical tools in the omics analysis toolbox. These related articles cover the ordination methods, differential screening, and correlation techniques that frequently accompany network construction.
Unsupervised and supervised ordination often precedes network analysis. Learn how PCA, PLS-DA, and OPLS-DA differ in when to use them and how to avoid overfitting.
Correlation heatmaps are the compact counterpart of correlation networks. Master Pearson versus Spearman choices, clustering, and interpretation of correlation matrices.
The definitive companion to the co-expression section of this article: soft thresholding, module detection, eigengenes, and trait associations in practice.
Learn how fold change, p-values, FDR, and VIP support differential feature analysis and complement network-based interpretation. For unsupervised WGCNA, filter features by data quality, expression, or variability rather than selecting only differentially expressed genes.
Extends pairwise correlation to cross-omics integration, covering matched-sample design, correlation strategies across data layers, and interpretation limits.
A focused comparison of the two most common multivariate approaches, including when unsupervised exploration should take priority over supervised modeling.
References
[1] Langfelder P, Horvath S. WGCNA: an R package for weighted correlation network analysis. BMC Bioinformatics. 2008 Dec 29;9:559. doi: 10.1186/1471-2105-9-559.
[2] Langfelder P, Luo R, Oldham MC, Horvath S. Is my network module preserved and reproducible? PLoS Comput Biol. 2011 Jan 20;7(1):e1001057. doi: 10.1371/journal.pcbi.1001057.
[3] Wang H, Qiu Y, Guo H, Yin Y, Liu P. Information-incorporated gene network construction with FDR control. Bioinformatics. 2024 Mar 4;40(3):btae125. doi: 10.1093/bioinformatics/btae125.
[4] Iyer G, Brandenburg M, Patsalis C, Michailidis G, Karnovsky A. CorrelationCalculator and Filigree: Tools for Data-Driven Network Analysis of Metabolomics Data. J Vis Exp. 2023 Nov 10;(201):10.3791/65512. doi: 10.3791/65512.
[5] Liu W, Vu T, Konigsberg IR, Pratte KA, Zhuang Y, Kechris KJ. SmCCNet 2.0: a comprehensive tool for multi-omics network inference with Shiny visualization. BMC Bioinformatics. 2024;25:276. doi: 10.1186/s12859-024-05900-9.
[6] Tommasini D, Fogel BL. multiWGCNA: an R package for deep mining gene co-expression networks in multi-trait expression data. BMC Bioinformatics. 2023 Mar 24;24(1):115. doi: 10.1186/s12859-023-05233-z.
[7] Morabito S, Reese F, Rahimzadeh N, Miyoshi E, Swarup V. hdWGCNA identifies co-expression networks in high-dimensional transcriptomics data. Cell Rep Methods. 2023 Jun 12;3(6):100498. doi: 10.1016/j.crmeth.2023.100498.