Omics datasets often contain hundreds or thousands of molecular features measured alongside clinical, biological, and technical variables. Two metabolites, proteins, genes, or microbial taxa may show a strong correlation even when part of that association is driven by age, body mass index, treatment, cell composition, or analytical batch. Partial correlation asks a more focused question: does the association remain after selected covariates are considered? This guide explains the principle, appropriate use, practical workflow, major omics applications, and interpretation limits of confounder-adjusted association analysis.
1. What Is Partial Correlation in Omics?
1.1 Conditional Association and Residual Intuition
A partial correlation coefficient describes the direction and strength of the remaining association between X and Y after a specified covariate set Z has been controlled. It generally ranges from -1 to 1 and is symmetric, so it does not assign an exposure-outcome direction or estimate a causal effect. Under specific assumptions, particularly a multivariate Gaussian model, a zero partial correlation may correspond to conditional independence; outside those assumptions, it should not automatically be interpreted as complete independence (Baba et al., 2004).
The residual view provides the clearest practical explanation. X is first modeled using Z and its unexplained component is retained. The same procedure is applied to Y, and the two residual series are then correlated. If two metabolites both increase with age, their raw correlation may partly reflect this common trend. An age-adjusted partial correlation asks whether samples with higher-than-expected values of one metabolite also tend to have higher-than-expected values of the other after age-related variation is removed.
1.2 Calculation and Basic Method Choice
When a single covariate Z is controlled, the coefficient can be written as:
r(X,Y | Z) = [r(X,Y) - r(X,Z)r(Y,Z)] / √([1 - r(X,Z)^2][1 - r(Y,Z)^2])
Multiple covariates are usually handled through regression residuals or matrix-based methods. Partial Pearson correlation is suitable when the residual relationship is approximately linear and the data have undergone study-appropriate preprocessing. Rank-based alternatives may be useful for monotonic relationships, skewed distributions, or reduced sensitivity to extreme observations, but the implementation should be reported because software packages may define partial Spearman correlation differently. Coefficients should be interpreted with sample size, confidence intervals, data distribution, and the chosen covariates rather than by P values alone.
2. Why and When Partial Correlation Matters in Omics
2.1 Shared Drivers and Potential Confounders
Pearson or Spearman correlation describes a marginal association across the observed samples, whereas partial correlation describes an association conditional on a stated set of variables. A shared driver can create or amplify an observed relationship: two metabolites may both vary with age, renal function, medication use, disease severity, or sample-processing batch. After adjustment, the coefficient may decrease, remain similar, increase, or reverse direction. Attenuation does not make the raw result mathematically incorrect; it indicates that part of the marginal association is compatible with variation shared through the selected covariates. A stable adjusted coefficient is robust to that adjustment set but does not rule out residual or unmeasured confounding.
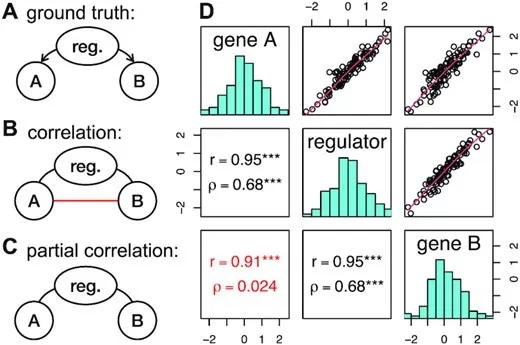
Figure 1. Pearson and partial correlation networks in a simulated shared-regulator scenario. Pearson correlation introduces an indirect Gene A-Gene B edge, whereas partial correlation removes it after accounting for the common regulator. Reproduced from Shutta et al. (2023), Nucleic Acids Research, licensed under CC BY 4.0.
Potential covariates include age, sex, body mass index, diet, smoking, medication, disease stage, organ function, circadian timing, analytical batch, run order, instrument drift, storage duration, center, freeze-thaw history, tissue heterogeneity, and cell-type composition. These variables are not automatically confounders in every analysis; their role depends on the research question and assumed relationships among variables. In microbiome studies, imbalances in host lifestyle and physiological variables can contribute to apparent disease-associated differences, illustrating why metadata collection and design-stage control are essential (Vujkovic-Cvijin et al., 2020).
2.2 Partial Correlation Versus Alternative Methods
Partial correlation is best suited to asking whether X and Y remain associated after prespecified external covariates are controlled. Multiple regression is usually preferable when one variable has a clear outcome role and a directional effect estimate is required. Machine-learning models are used primarily for prediction, whereas Gaussian graphical models estimate networks of conditional dependencies among molecular features. External variables such as age, sex, or batch still require separate handling in a graphical-model workflow.
Table 1. Choosing Among Correlation, Partial Correlation, Regression, and Graphical Models in Omics Analysis
| Method | Best-suited question | Handling of other variables | Main output or limitation |
|---|---|---|---|
| Pearson correlation | Are X and Y linearly associated? | No covariate adjustment | Linear marginal association; sensitive to nonlinearity and outliers |
| Spearman correlation | Are X and Y monotonically associated? | No covariate adjustment | Rank-based marginal association; does not control confounders |
| Pairwise partial correlation | Are X and Y associated after external covariates are controlled? | Adjusts prespecified covariates | Symmetric adjusted association; not a causal effect |
| Multiple regression | How does X relate to a defined outcome while other predictors are modeled? | Adjusts prespecified covariates | Directional estimate; model depends on the outcome type |
| Graphical model or graphical lasso | Which dependencies remain after other features are conditioned on? | Conditions on other features; external covariates need separate handling | Sparse network; depends on regularization and assumptions |
3. A Practical Workflow for Partial Correlation Analysis
3.1 Define the Question, Experimental Unit, and Data Alignment
Define what X and Y represent and whether the goal is a metabolite-metabolite association, phenotype-metabolite association, cross-omics association, or network structure. External covariates such as age or batch must be distinguished from molecular features conditioned on within a network. The experimental unit also matters: standard inferential procedures generally assume independent observations, whereas paired samples, longitudinal measurements, repeated measures, family structures, or multicenter clustering require models that represent within-unit dependence (Bakdash & Marusich, 2017).
All data layers should refer to the same biological units and compatible time points. Sample identifiers, treatment groups, batches, centers, medication records, and key clinical variables should be checked before merging. Missing-data handling should also be prespecified. Complete-case analysis can reduce power, while pairwise deletion may cause different network edges to use different sample sets. The effective sample size should be reported, and any imputation strategy should match the data type and plausible missingness mechanism.
3.2 Select Covariates Without Overadjustment
Covariates should be chosen from the study design and biological assumptions rather than by searching for the model that produces the strongest significance. A confounder can bias the target association; a mediator lies on a hypothesized pathway and may represent part of the mechanism of interest; a collider is a common effect of two variables, and conditioning on it can induce an association. More adjustment is therefore not always better. Controlling an intermediate variable can introduce overadjustment bias, while unnecessary variables may reduce precision without reducing bias (Schisterman et al., 2009). Primary and sensitivity covariate sets should be prespecified when possible, with attention to sample size and collinearity.
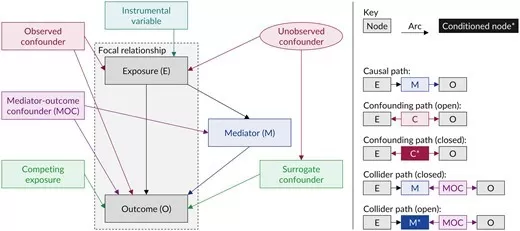
Figure 2. DAG components relevant to covariate selection, including confounders, mediators, competing exposures, and colliders. Reproduced from Tennant et al. (2021), International Journal of Epidemiology, licensed under CC BY 4.0.
3.3 Preprocess Data and Choose the Estimator
Each omics layer requires appropriate feature filtering, transformation, normalization, missing-value handling, and outlier assessment. Batch, run order, instrument drift, and sample composition should be evaluated using quality-control data and study metadata. Principal components, surrogate variables, or latent factors can summarize unwanted structure, but they are not automatically proven confounders and may contain both technical and biological variation. Aggressive correction can remove meaningful signal and alter network structure (Cote et al., 2022). Statistical adjustment also cannot repair complete confounding between batch and phenotype, poor randomization, severe degradation, or inadequate analytical quality control.
Low-dimensional analysis can use partial Pearson correlation or a clearly defined rank-based alternative. High-dimensional conditional networks may derive partial correlations from the precision matrix, the inverse of the covariance matrix:
ρ(i,j | rest) = -Ω(i,j) / √[Ω(i,i)Ω(j,j)]
Under a fitted Gaussian graphical model, an estimated nonzero off-diagonal precision-matrix element indicates conditional dependence. This framework can recover biochemical neighborhood information obscured by dense marginal correlations (Krumsiek et al., 2011), but conditioning on other molecular features does not automatically adjust age, sex, batch, or other external variables. When the number of features approaches or exceeds the number of samples, shrinkage covariance estimators or graphical lasso may be needed; the resulting edges depend on regularization and modeling assumptions (Schäfer & Strimmer, 2005; Friedman et al., 2008).
3.4 Report Results, Assess Robustness, and Validate
For prespecified pairwise analyses, report the partial correlation coefficient, confidence interval, P value, FDR-adjusted P value where applicable, effective sample size, controlled covariates, and their rationale. Regularized networks require the estimation method, penalty-selection procedure, preprocessing, external covariate handling, and edge-stability assessment. Robustness can be examined by comparing unadjusted, minimally adjusted, and fully adjusted models and by varying plausible transformations, outlier rules, or covariate sets. Resampling-based assessment and stability selection can show whether edges persist across perturbed datasets (Meinshausen & Bühlmann, 2010); independent cohorts and targeted experiments provide stronger validation when available.
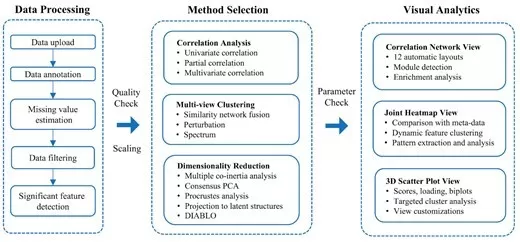
Figure 3. Multi-omics workflow covering data processing, quality assessment, normalization, method selection, network analysis, and visualization. Reproduced from Zhou et al. (2021), Nucleic Acids Research, licensed under CC BY 4.0.
4. Applications and Interpretation in Metabolomics and Multi-Omics
4.1 Metabolite Networks and Pathway Hypothesis Generation
Covariate-adjusted metabolite networks can identify groups of metabolites whose associations persist after selected demographic or technical factors are considered. Conditional networks may further reduce indirect edges caused by other measured metabolites. Gaussian graphical models have reconstructed local biochemical relationships and supported pathway hypothesis generation in metabolomics, but a statistical edge is not proof of a direct enzymatic reaction (Krumsiek et al., 2011).
4.2 Phenotype, Biomarker, and Cross-Omics Associations
Pairwise partial correlation can evaluate whether a quantitative phenotype, disease-severity score, drug-response measure, or clinical trait remains associated with a metabolite after relevant covariates are included. In biomarker studies, it can prioritize candidates whose associations are not fully explained by known clinical or technical factors. Adjusted association alone does not establish predictive performance; candidates still require reproducible measurement, independent validation, and evaluation within an appropriate prediction model. Directional effects, binary endpoints, time-to-event outcomes, and prediction scores generally require outcome-specific regression or predictive modeling.
Cross-omics analyses can evaluate associations among genes, proteins, lipids, cytokines, microbial features, and metabolites while accounting for batch, treatment, center, or sample composition. Because the number of tested pairs can be large, multiplicity control and stability assessment are essential. Microbiome-metabolome analysis needs additional care because relative abundances are compositional and subject to a closure constraint. Appropriate transformations, compositional methods, sparse-count handling, or dedicated cross-domain network approaches should be considered rather than treating conventional partial correlation as a universal solution (Gloor et al., 2017).
Table 2. Partial Correlation Strategies for Common Omics Research Questions
| Research question | Suggested analysis form | Key covariates or constraints | Validation priority |
|---|---|---|---|
| Metabolite network | Covariate-adjusted network or graphical model | Age, sex, BMI, batch, sample size, and whether other metabolites are conditioned on | Edge stability and pathway-level validation |
| Phenotype-metabolite association | Pairwise partial correlation or outcome-specific regression | Medication, disease stage, demographic factors, and technical batch | Independent cohort or prespecified replication |
| Transcriptome/proteome-metabolome association | Cross-omics association analysis | Batch, cell composition, treatment, and multiple-testing burden | FDR control, stability, and biological replication |
| Microbiome-metabolome association | Compositional-aware cross-omics method | Diet, antibiotics, sequencing factors, closure, and sparse counts | Alternative transformations and external replication |
4.3 Interpret Raw and Adjusted Associations
Adjustment can change the magnitude, direction, uncertainty, and significance of an association. A large raw coefficient that becomes small suggests that selected covariates explain part of the shared variation. A similar coefficient is relatively robust to that adjustment set; a stronger adjusted association may reflect suppression or masking; and a sign reversal may arise from subgroup heterogeneity, collinearity, overadjustment, model instability, or a different conditional relationship.
Table 3. Interpreting Changes Between Raw and Covariate-Adjusted Correlations
| Raw correlation | Adjusted correlation | Possible interpretation |
|---|---|---|
| Large magnitude | Attenuated or near zero | A shared covariate may explain part of the association |
| Large magnitude | Similar magnitude | The association is relatively robust to the selected adjustment |
| Small or unclear | Larger magnitude | A suppressor or masking factor may be present |
| Either sign | Opposite sign | Heterogeneity, collinearity, overadjustment, or model instability should be examined |
Common errors include selecting covariates after viewing results, presenting only significant edges, or describing an adjusted coefficient as a direct biological interaction. An edge that disappears is not proof that the original association was spurious, and an edge that appears after adjustment is not proof that a hidden mechanism has been revealed. Interpretation should also consider uncertainty, sample size, missingness, nonlinearity, subgroup structure, feature-identification confidence, analytical precision, sample type, and biological timing. Network diagrams are statistical summaries and hypothesis-generation tools, not maps of confirmed reactions or causal paths.
5. Limitations and Minimum Reporting Standards
Partial correlation does not prove causality, control unmeasured confounding, guarantee correct covariate selection, or resolve measurement error and selection bias. Linear methods may miss nonlinear conditional relationships, while small samples, many covariates, and strong collinearity can make estimates unstable. Ordinary methods are inappropriate for correlated observations unless the dependence structure is modeled, and complete confounding between phenotype and batch cannot be solved by statistical adjustment alone.
A reproducible report should state the research question, roles of X and Y, sample design, covariates and their rationale, matching and missing-data procedures, preprocessing and technical corrections, estimator definition, software and version, and key parameters. Pairwise analyses should report coefficients, confidence intervals, P values or FDR, and effective sample sizes. High-dimensional networks should report regularization, tuning, edge stability, and external covariate handling. Raw and adjusted results should be shown together with sensitivity analyses and explicit discussion of unmeasured confounding and validation limitations. The value of partial correlation is not the production of more significant edges, but a clearer statement of the association question, the variables held constant, and the uncertainty that remains.
How MetwareBio Supports Confounder-Aware Omics Analysis
A confounder-aware omics project requires high-quality molecular measurements, matched samples, sufficiently complete metadata, and analysis choices aligned with the study design. MetwareBio's metabolomics services, proteomics services, and multi-omics solutions provide comprehensive support for confounder-aware omics research through study-design guidance, platform-specific quality control, data analysis, and biological interpretation. Bioinformatics strategies can be tailored to sample structure, covariate availability, and the need for pairwise correlation, network visualization, or cross-omics integration.
Interested in confounder-adjusted metabolomics or multi-omics association analysis? Contact MetwareBio to discuss study design, metadata requirements, omics data generation, and customized correlation or network analysis strategies for your project.
Contact UsRead More
Explore these related articles on correlation methods, network analysis, and statistical foundations to build a comprehensive confounder-aware omics analysis strategy.
A broad overview of correlation methods and network construction techniques, complementing the partial correlation framework discussed in this article.
A practical guide to Pearson correlation analysis, the foundational method upon which partial correlation builds by adding covariate adjustment.
Learn how to construct and interpret correlation networks in omics, including visualization strategies for both marginal and conditional association networks.
Discover CCA as an alternative multi-omics integration method that identifies maximally correlated linear combinations across data layers, complementing pairwise partial correlation.
Understand WGCNA, a network construction approach that uses correlation to identify gene modules, relevant to the network analysis context of partial correlation.
A guide to normality testing that informs the choice between parametric and rank-based correlation methods, directly relevant to partial Pearson vs partial Spearman selection.
References
- Baba, K., Shibata, R., & Sibuya, M. (2004). Partial correlation and conditional correlation as measures of conditional independence. Australian & New Zealand Journal of Statistics, 46(4), 657-664. https://doi.org/10.1111/j.1467-842X.2004.00360.x
- Bakdash, J. Z., & Marusich, L. R. (2017). Repeated measures correlation. Frontiers in Psychology, 8, 456. https://doi.org/10.3389/fpsyg.2017.00456
- Cote, A. C., Young, H. E., & Huckins, L. M. (2022). Comparison of confound adjustment methods in the construction of gene co-expression networks. Genome Biology, 23, 44. https://doi.org/10.1186/s13059-022-02606-0
- Friedman, J., Hastie, T., & Tibshirani, R. (2008). Sparse inverse covariance estimation with the graphical lasso. Biostatistics, 9(3), 432-441. https://doi.org/10.1093/biostatistics/kxm045
- Gloor, G. B., Macklaim, J. M., Pawlowsky-Glahn, V., & Egozcue, J. J. (2017). Microbiome datasets are compositional: And this is not optional. Frontiers in Microbiology, 8, 2224. https://doi.org/10.3389/fmicb.2017.02224
- Krumsiek, J., Suhre, K., Illig, T., Adamski, J., & Theis, F. J. (2011). Gaussian graphical modeling reconstructs pathway reactions from high-throughput metabolomics data. BMC Systems Biology, 5, 21. https://doi.org/10.1186/1752-0509-5-21
- Meinshausen, N., & Bühlmann, P. (2010). Stability selection. Journal of the Royal Statistical Society: Series B (Statistical Methodology), 72(4), 417-473. https://doi.org/10.1111/j.1467-9868.2010.00740.x
- Schäfer, J., & Strimmer, K. (2005). A shrinkage approach to large-scale covariance matrix estimation and implications for functional genomics. Statistical Applications in Genetics and Molecular Biology, 4(1), Article 32. https://doi.org/10.2202/1544-6115.1175
- Schisterman, E. F., Cole, S. R., & Platt, R. W. (2009). Overadjustment bias and unnecessary adjustment in epidemiologic studies. Epidemiology, 20(4), 488-495. https://doi.org/10.1097/EDE.0b013e3181a819a1
- Vujkovic-Cvijin, I., Sklar, J., Jiang, L., Natarajan, L., Knight, R., & Belkaid, Y. (2020). Host variables confound gut microbiota studies of human disease. Nature, 587, 448-454. https://doi.org/10.1038/s41586-020-2881-9
- Shutta, K. H., Weighill, D., Burkholz, R., Ben Guebila, M., DeMeo, D. L., Zacharias, H. U., Quackenbush, J., & Altenbuchinger, M. (2023). DRAGON: Determining regulatory associations using graphical models on multi-omic networks. Nucleic Acids Research, 51(3), e15. https://doi.org/10.1093/nar/gkac1157
- Tennant, P. W. G., Murray, E. J., Arnold, K. F., Berrie, L., Fox, M. P., Gadd, S. C., Harrison, W. J., Keeble, C., Ranker, L. R., Textor, J., Tomova, G. D., Gilthorpe, M. S., & Ellison, G. T. H. (2021). Use of directed acyclic graphs (DAGs) to identify confounders in applied health research: Review and recommendations. International Journal of Epidemiology, 50(2), 620-632. https://doi.org/10.1093/ije/dyaa213
- Zhou, G., Ewald, J., & Xia, J. (2021). OmicsAnalyst: A comprehensive web-based platform for visual analytics of multi-omics data. Nucleic Acids Research, 49(W1), W476-W482. https://doi.org/10.1093/nar/gkab394