Spatial Multi-Omics Technologies: Unlocking the Spatiotemporal Code of Life
As life sciences enter the era of "spatial resolution," Spatial Multi-Omics Technologies are revolutionizing research paradigms in disease mechanisms, developmental biology, and precision medicine. By integrating molecular expression with spatial localization, three core technologies—Spatial Metabolomics, Spatial Proteomics, and Spatial Transcriptomics—provide unprecedented insights into molecular interaction networks within tissue microenvironments. This blog delves into their workflows, analytical strengths, and transformative potential in biomedicine.
Spatial Metabolomics: Decoding the Spatial Landscape of Metabolites
Chromatography-mass spectrometry (LC-MS) is a powerful tool for metabolomics, offering high separation efficiency and analytical capabilities. However, the homogenization process required for tissue preparation in LC-MS results in the loss of spatial distribution information of metabolites. Mass Spectrometry Imaging (MSI), a novel molecular imaging technique, combines mass spectrometry with two-dimensional spatial imaging, enabling both quantitative and qualitative analysis. Unlike other imaging methods (e.g., fluorescence imaging, radioactive labeling), MSI does not require chemical or radioactive labeling or complex sample preparation, offering high sensitivity, efficiency, and the preservation of spatial information. It is widely used in tumor research, biomarker discovery, drug development, and metabolic disease studies, holding significant promise in precision medicine, translational research, and basic life sciences.
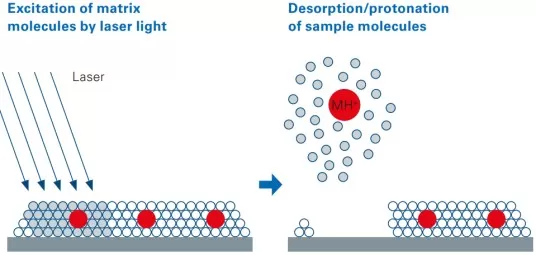
Matrix-Assisted Laser Desorption/Ionization (MALDI) is a key technique in MSI. It involves mixing a matrix that absorbs UV laser light (337 nm or 355 nm) with the analyte to form co-crystals. The matrix absorbs laser energy, aiding in the ionization of the analyte. The laser beam scans the tissue sample, generating ions at each sampling point. The ions are then separated and detected by the mass spectrometer, producing a mass spectrum associated with the spatial location of the sample. This process yields a spatial distribution map of metabolites (50-1300 Da) across the tissue.

MALDI imaging schematic
Experimental Workflow of Spatial Metabolomics
The MALDI-MSI workflow includes sample collection, tissue sectioning, matrix coating, MSI detection, and data analysis.
1. Sample Preparation
Tissue samples are sectioned at 12 µm thickness using a Leica CM1950 cryostat. After retrieval from a -80°C freezer, the tissue is equilibrated at -20°C in the cryostat for 1 hour. The sample is mounted on a specimen holder, adjusted for proper orientation, and fixed onto the cryostat’s positioning stage. Sections are transferred to pre-chilled ITO-coated glass slides using a pre-cooled brush. The slide is pressed against the back of the hand to melt the tissue section until transparent. Excess moisture is removed by gently rubbing the back of the slide, causing the tissue to transition from transparent to opaque. Finally, the slides are vacuum-dried for 30 minutes.
2. Matrix Coating
A 15 mg/mL DHB (2,5-dihydroxybenzoic acid) matrix solution is prepared in 90% acetonitrile:10% water (v/v). The solution is uniformly sprayed onto the tissue sections using a TM-Sprayer with the following parameters: temperature = 60°C, flow rate = 0.12 mL/min, pressure = 6 psi. A total of 28 coating cycles are performed, with a 5-second drying interval between cycles.
3. Mass Spectrometry Imaging (MSI)
The matrix-coated ITO slides are placed onto the mass spectrometer target plate. Using Bruker’s DataImaging software, the tissue region of interest is selected, and imaging parameters are set to a spatial resolution of 50 µm (i.e., a grid size of 50 µm × 50 µm). The mass range is defined as 50–1300 Da. The tissue is raster-scanned by a laser beam, which ionizes molecules via matrix-assisted desorption/ionization. The resulting ions are detected by the mass spectrometer, generating raw data containing mass-to-charge ratio (m/z) and peak intensity values for each pixel. Raw data are imported into SCiLS Lab software for smoothing and root mean square (RMS) normalization, converting relative intensity values into pixel-based heatmaps.
4. Data Analysis
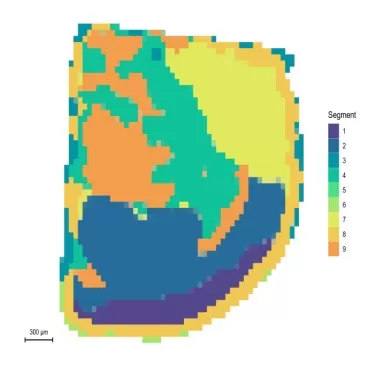
Spatial Segmentation: This method provides an overview of the MSI dataset by grouping pixels with similar spectral profiles into distinct regions, each assigned a specific color. Spatially-Aware Nearest Shrunken Centroids Clustering: Metabolic intensity data are analyzed using spatially-aware clustering algorithms to partition the tissue into regions of interest (ROIs). The Euclidean distance between centroids reflects inter-cluster heterogeneity, with larger distances indicating greater regional differences.

Space segmentation graph
Spatial Proteomics: Mapping Protein Expression and Localization
The tissue microenvironment, composed of cells and extracellular matrices, is highly heterogeneous and plays a crucial role in disease progression, such as cancer. While spatial transcriptomics has made significant strides, spatial proteomics faces challenges, including the lack of intelligent cell recognition and efficient sample processing for low-abundance proteins.
In 2024, Nature Methods awarded "Method of the Year" to Deep Visual Proteomics (DVP), a technology developed by Matthias Mann's team at the Max Planck Institute of Biochemistry. DVP overcomes the limitations of traditional immunofluorescence by enabling the detection of over 10,000 proteins in a single run. It combines laser capture microdissection (LCM) with mass spectrometry to analyze spatial protein networks at single-cell resolution. Nature Methods hailed DVP as "redefining the boundaries of spatial proteomics—it's not just a map, but a dynamic key to decoding disease mechanisms."

New technology: spatial proteomes
The Workflow of Spatial Proteomics
The experimental workflow for spatial proteomics primarily consists of two main parts: i) Visualization: Sample quality control, section staining, and identification of regions for laser capture. ii) Proteomics: Sample preparation, liquid chromatography-mass spectrometry (LC-MS/MS) analysis, qualitative and quantitative data analysis, and bioinformatics integration.
1. Visualization: Multicolor Fluorescence Immunostaining and Imaging Analysis
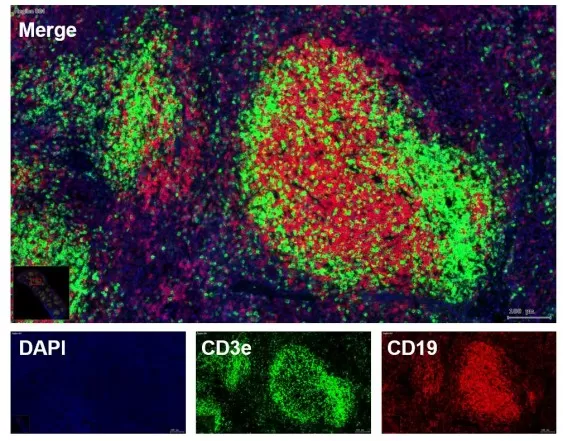
Tissue samples are prepared using either a cryostat (for frozen sections) or a microtome (for paraffin-embedded sections). The sections are stained with Hematoxylin and Eosin (H&E), immunohistochemistry (IHC), or multicolor fluorescence. The stained samples are imaged using the TissueFAXS Plus system, which provides high-resolution optical imaging at the centimeter scale. For example, the image below shows a paraffin-embedded spleen section stained with three fluorescent markers: CD19 (red) for B cells and CD3e (green) for T cells. This allows for the visualization of the spatial distribution of T and B cells across large tissue areas.
For Optical Imaging Analysis, The acquired images are analyzed using specialized software, TissueFAXS SQ, which performs tasks such as:
- Identification of different tissue regions.
- Calculation of regional areas.
- Determination of cell density in specific regions.
- Selection of specific cell types.
- Analysis of the distribution of certain cell types at varying distances from a target region.

Fluorescence Immunostaining Image of Tissue Section
2. Selection of Target Regions for Laser Capture
Using a Laser Capture Microdissection (LCM) platform, the stained tissue sections are imaged in real-time, allowing the user to select specific regions or single cells for subsequent proteomic analysis. This process supports real-time, user-guided selection of regions of interest (ROIs) or individual cells, ensuring precision and accuracy. Note that this process is compatible with H&E, IHC, and up to three-color fluorescence staining.
3. Quality Control (QC) and Sample Preparation
Lysis and Protein Extraction:
The captured tissue regions or cells are lysed using an appropriate lysis buffer, followed by sonication and heating to extract proteins. The lysate is then transferred to SISPROT tips for further processing according to the manufacturer’s protocol. The resulting peptides are lyophilized and reconstituted in an acidic iRT solution for LC-MS/MS analysis.
Liquid Chromatography (LC) Separation:
Peptide samples are separated using the nEASY LC1000 system with the following mobile phases:
Mobile Phase A: 0.1% formic acid in water.
Mobile Phase B: 0.1% formic acid in acetonitrile.
The total gradient time is 80 minutes.
Mass Spectrometry (MS) Data Acquisition:
The separated peptides are analyzed using a timsTOF Pro2 mass spectrometer (Bruker) with the following parameters:
- Ionization Mode: Positive ion mode.
- MS and MS/MS Scan Range: 300–1500 m/z.
- Ion Mobility Range: 0.75–1.3.
- Data Acquisition Mode: Data-independent acquisition (DIA) with dia-PASEF.
- Each cycle includes 8 dia-PASEF scans.
- Each dia-PASEF scan window consists of 4 ion mobility steps.
- Ion accumulation time: 200 ms.
4. Automated Cell Type Identification and Localization
The workflow also includes automated cell type identification and localization, enabling precise mapping of different cell types within the tissue microenvironment. This step is critical for understanding the spatial organization of proteins and their functional roles in complex tissues.

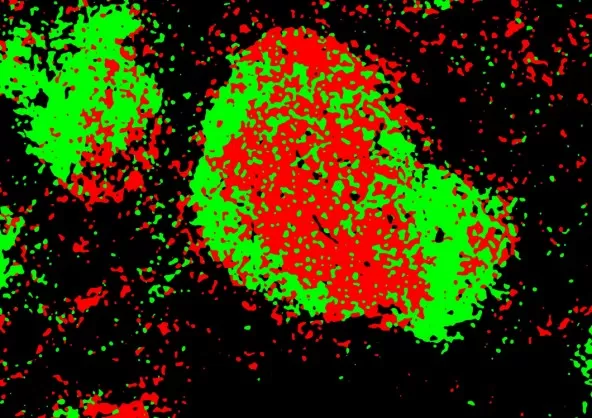
Automatic recognition and localization of different cell types
Spatial Transcriptomics: A Geographic Information System for Gene Expression
Spatial Transcriptomics is an emerging technology that enables the simultaneous detection of gene expression at hundreds to thousands of locations within a tissue section. This technology provides a spatial map of gene expression and cell types, offering new insights into cellular interactions and gene regulation.
Comparison of Spatial Transcriptomics Platforms
Two leading platforms in spatial transcriptomics are 10x Genomics' Visium and 10xHD technologies. While both platforms offer spatial gene expression analysis, they differ in several key aspects:
Chip Design:
Visium uses standard microscope slides with 55 µm spots, while 10xHD features a 6.5 mm x 6.5 mm capture area with 2 µm x 2 µm barcoded arrays, providing higher resolution and full tissue coverage.
Capture Probes:
Visium uses poly(dT) probes to capture mRNA, whereas 10xHD employs gene-specific probes, enhancing specificity and sensitivity.
Sample Types:
Visium is compatible with fresh-frozen and FFPE samples, while 10xHD initially focused on FFPE samples but now supports both.
Data Analysis:
Visium analyzes data at 55 µm resolution, while 10xHD offers single-cell resolution, making it ideal for studying complex biological processes like tumor microenvironments.
The Future of Spatial Multi-Omics: A Window into Life's Complexity
From tracking metabolic dynamics with Spatial Metabolomics, mapping signaling pathways with Spatial Proteomics, to reconstructing gene regulatory networks with Spatial Transcriptomics, these technologies are driving life sciences from qualitative descriptions to quantitative modeling. As costs decrease and standardized workflows are established, Spatial Multi-Omics will become the ultimate tool for decoding tissue microenvironments and tackling complex diseases.
In conclusion, the integration of spatial multi-omics technologies is not just a technological advancement—it's a paradigm shift in how we understand life at the molecular level. The future of biomedical research lies in the ability to visualize and analyze the intricate spatial relationships within tissues, opening new doors for precision medicine and therapeutic innovation.


