Spatial Metabolomics: MALDI-MSI vs. AFADESI-MSI, Key Technologies, and Applications
Spatial metabolomics has emerged as a transformative approach in life sciences, bridging the gap between traditional metabolomics and spatial biology. By mapping the distribution of metabolites within biological tissues, this technology offers unprecedented insights into metabolic dynamics across diverse fields, from clinical diagnostics to plant physiology. However, its adoption is often hindered by technical complexities in mass spectrometry imaging (MSI), sample preparation, and data analysis. This blog addresses common questions and provides actionable insights to empower researchers in harnessing spatial metabolomics effectively. Curious about the differences between MALDI and AFADESI-MSI? Jump to the comparison table to explore their respective strengths.
1. Spatial Metabolomics vs. Traditional Metabolomics: A Paradigm Shift
Traditional metabolomics quantifies global metabolite levels in homogenized samples but lacks spatial context. Many metabolites exhibit tissue-specific localization, which is critical for understanding dynamic metabolic networks. Spatial metabolomics integrates MSI with metabolomics to resolve ‘what’, ‘how much’, and ‘where’metabolites exist in biological systems. Key advantages include:
- Label-Free Molecular Imaging: Eliminates the need for fluorescent tags or antibodies.
- High Sensitivity: Detects metabolites at ppm to ppb levels.
- Multidimensional Data: Combines quantitative, qualitative, and spatial information.
Applications span oncology (tumor heterogeneity), neuroscience (metabolic gradients in brain regions), and agriculture (stress-response pathways in crops).
2. Core Technologies in Spatial Metabolomics
1) MALDI-MSI (Matrix-Assisted Laser Desorption/Ionization)
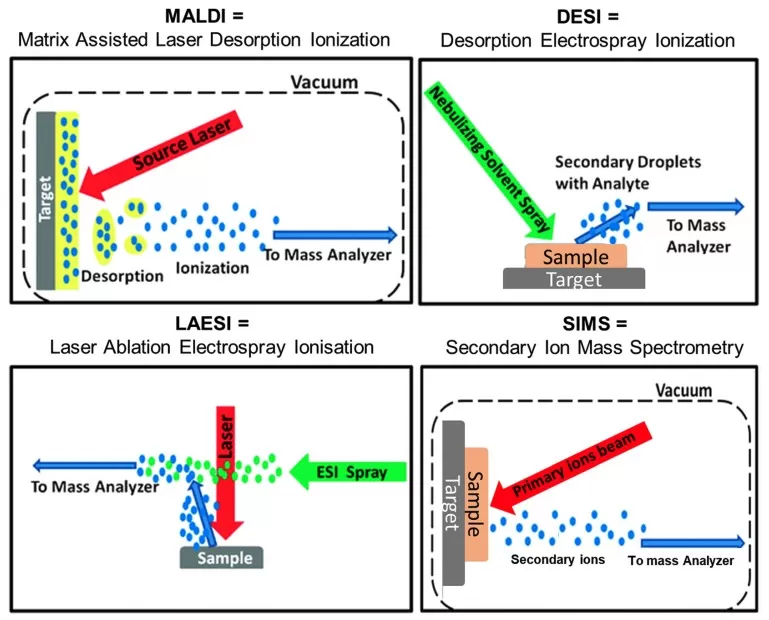
- Principle: A matrix co-crystallizes with analytes. Laser irradiation sublimates the matrix, desorbing and ionizing molecules for mass analysis.
- Strengths: Broad mass range (up to 100 kDa), high spatial resolution (5–50 μm), and compatibility with lipids, peptides, and small molecules.
- Limitations: Matrix interference and potential analyte fragmentation.
2) DESI-MSI (Desorption Electrospray Ionization)
- Principle: Charged solvent droplets desorb analytes from tissue surfaces, enabling ambient ionization.
- Strengths: No matrix required, preserves tissue integrity, and works under atmospheric pressure.
- Applications: Intraoperative tumor margin assessment, drug distribution studies.
3) LAESI-MSI (Laser Ablation Electrospray Ionization)
- Principle: Mid-IR lasers ablate hydrated samples, generating plumes captured and ionized by electrospray.
- Strengths: Ideal for water-rich samples (e.g., plant tissues).
- Limitations: Lower spatial resolution (~100 μm).
4) SIMS-MSI (Secondary Ion Mass Spectrometry)
- Principle: Primary ion beams sputter surface atoms, generating secondary ions for analysis.
- Strengths: Ultra-high resolution (sub-μm) for inorganic ions and small molecules.
- Limitations: Limited to molecules <1,000 Da due to fragmentation

Core Technologies in Spatial Metabolomics
3. Technology Adoption and Comparative Insights
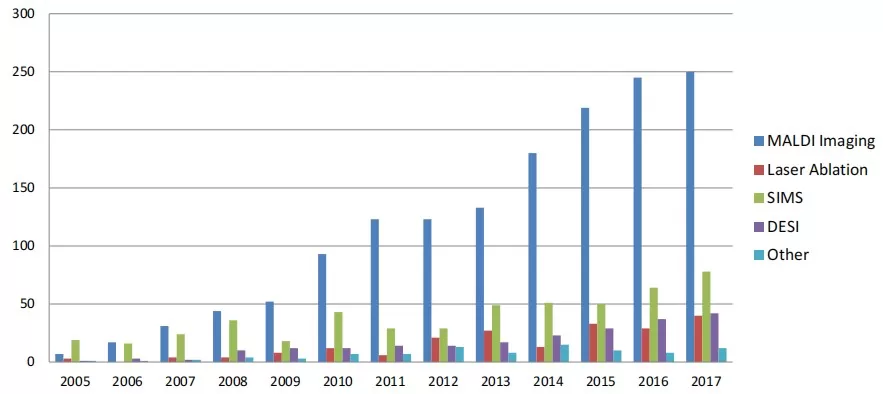
A PubMed analysis reveals MALDI-MSI dominates publications (~60%), followed by DESI (~30%), with LAESI and SIMS lagging.

Number of publications by ion source for MSI
4. Comparison of MALDI-MSI vs. AFADESI-MSI
The differences between MALDI-MSI and AFADESI-MSI include sample compatibility, the type of slides used, the maximum detection area, the need for matrix coating, resolution, mass range, detection time, the number of detected metabolites, and the use of MS2 for qualitative analysis.
|
Parameter |
MALDI-MSI |
AFADESI-MSI |
|
Sample Type |
Conventional sliceable samples |
1) Conventional sliceable samples; 2) Fresh leaves, petals, and non-sliceable herbal samples; 3) Pre-sliced samples on adhesive slides |
|
Processing Method |
Slicing |
Slicing; Blotting |
|
Slides |
ITO slides |
Conventional adhesive slides |
|
Maximum Detection Area |
6.5cm x 4cm |
15cm x 4cm |
|
Matrix Coating |
DHB/9AA/DMCA/NEDC, etc. |
No matrix required |
|
Resolution |
1-100μm |
20μm, 40μm, 100μm |
|
Mass Range |
120-1000 Da |
70-1000 Da |
|
Detection Time |
11 minutes for 1cm² at 100μm resolution |
70 minutes for 1cm² at 100μm resolution |
|
Detected Metabolites |
~1500 |
1000-1200 |
|
MS2 Qualitative |
400+ |
No MS2 qualitative |
|
Summary |
High resolution, more detections, accurate qualitative analysis |
Compatible with more sample types |
5. Spatial Resolution: Balancing Detail and Efficiency
Spatial resolution should be tailored to the size of the tissue micro-region under investigation. Higher resolution does not universally yield superior results; optimal resolution depends on the sample type and research objectives. Practical recommendations include:
- Large Samples (e.g., whole animals or organs): 200 μm resolution provides sufficient detail while balancing acquisition time.
- Medium Samples (e.g., heart, brain, leaves, seeds): 50–100 μm resolution ensures adequate spatial coverage and metabolic profiling.
- Small Samples (e.g., <3 mm × 3 mm): Higher resolution (e.g., ≤20 μm) is essential to resolve fine metabolic features.
6. Qualitative and Quantitative Analysis in Spatial Metabolomics
Spatial metabolomics employs MALDI-MSI (Matrix-Assisted Laser Desorption/Ionization Mass Spectrometry Imaging) to acquire *m/z* (mass-to-charge ratio), signal intensity, and spatial coordinates of metabolites across tissue sections. To ensure accuracy:
- Qualitative Analysis: Metabolite identification is achieved by cross-referencing MSI data with a custom MALDI database derived from homogenized adjacent tissue slices.
- Quantitative Analysis: Signal intensities are normalized against internal standards or reference metabolites, enabling precise quantification.

Workflow of MALDI-MSI Spatial Metabolomics
7. Key Applications of Spatial Metabolomics
1) Medical Research
- Disease Mechanisms: Elucidates metabolic dysregulation in cancers, cardiovascular diseases, and neurodegenerative disorders (e.g., amyloid-beta distribution in Alzheimer’s disease).
- Drug Development: Tracks tissue-specific drug distribution and evaluates metabolite-mediated toxicity.
- Biomarker Discovery: Identifies spatially resolved metabolic signatures for early diagnosis and prognosis.
2) Plant Science
- Metabolite Localization: Maps secondary metabolites (e.g., alkaloids, terpenoids) in plant tissues.
- Stress Adaptation: Profiles metabolic responses to abiotic/biotic stressors (e.g., drought, pathogen infection).
- Genetic Engineering: Assesses metabolic perturbations in CRISPR-edited or transgenic plants.
3) Animal Studies
- Developmental Biology: Visualizes metabolic gradients during embryogenesis and organogenesis.
- Tissue-Specific Metabolism: Investigates spatial heterogeneity in organs such as the liver (xenobiotic metabolism) and brain (neurotransmitter distribution).
Spatial metabolomics bridges the gap between molecular composition and tissue architecture, offering unparalleled insights into metabolic networks. By optimizing resolution, leveraging advanced MALDI-MSI workflows, and employing robust bioinformatics, researchers can decode the spatial dynamics of metabolites in health, disease, and environmental interactions. As the field advances, integration with multi-omics approaches will further enhance its transformative potential.
References:
Dill AL, Eberlin LS, Ifa DR, Cooks RG. Perspectives in imaging using mass spectrometry. Chem Commun (Camb). 2011 Mar 14;47(10):2741-6. doi: 10.1039/c0cc03518a.
He MJ, Pu W, Wang X, Zhang W, Tang D, Dai Y. Comparing DESI-MSI and MALDI-MSI Mediated Spatial Metabolomics and Their Applications in Cancer Studies. Front Oncol. 2022 Jul 18;12:891018. doi: 10.3389/fonc.2022.891018.
Read more
- Spatial Metabolomics: Transforming Biomedical and Agricultural Research
- Spatial Metabolomics Explained: How It Works and Its Role in Cancer Research
- MALDI, DESI, or SIMS? How to Choose the Best MSI Techniques for Spatial Metabolomics
- How to Prepare Samples for Spatial Metabolomics: The Essential Guide You Need
- Unlocking Precision in Spatial Metabolomics: Essential Detection Parameters for Cutting-Edge Research
- Multi-Omics Association Analysis Series
- Omics Data Processing Series
- Omics Data Analysis Series


