Unlocking Life's Secrets with Spatial Metabolomics: A Revolutionary Lens into Biological Complexity
The "Revolutionary Lens" of Spatial Metabolomics
In the vast cosmos of life sciences, metabolites act as microscopic yet pivotal "stars," their spatial distribution and dynamics holding profound secrets about biological processes. Spatial metabolomics, a cutting-edge technology rooted in mass spectrometry imaging (MSI), has emerged as a transformative tool to capture these spatial details. By preserving the native architecture of tissues, this label-free, high-sensitivity technique enables researchers to map metabolites in their original context, revolutionizing fields like oncology, drug development, and metabolic disease research.
Untargeted Spatial Metabolomics: A Panoramic View of Metabolic Landscapes
Untargeted spatial metabolomics serves as a "panoramic detector" in metabolite research. Unlike traditional methods that homogenize tissues—erasing spatial information—this technology leverages matrix-assisted laser desorption/ionization (MALDI) and other MSI platforms to retain metabolite localization without chemical labeling. Key advantages include:
- Spatial Resolution: From 5 μm to 100 μm, enabling micro-to-macro analysis of tissues.
- Broad Molecular Coverage: Detects metabolites, lipids, and exogenous compounds (100–1300 Da).
- Translational Impact: Supports precision medicine by revealing metabolic heterogeneity in tumors or diseased tissues.
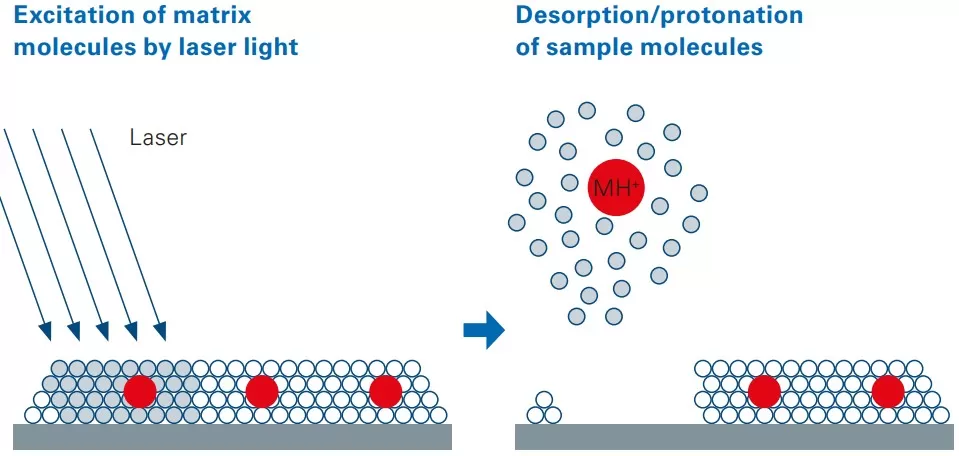
MALDI imaging schematic
Developed in 1988 by Karas and Hillenkamp, MALDI technology operates through a three-step mechanism: (1) matrix application, where analytes are co-crystallized with UV-absorbing matrices (e.g., DHB, CHCA) on a conductive slide; (2) laser desorption/ionization, using a pulsed 337–355 nm laser to vaporize the matrix and release intact analyte ions; and (3) mass analysis via instruments like the TimsTOF flex for m/z separation/detection—remaining unmatched in spatial resolution and molecular specificity despite advancements like AFADESI, which provides ambient ionization for rapid profiling.
Sample Preparation: Precision at Every Step
Spatial resolution determines the granularity of metabolic maps. Options range from 5 μm (for subcellular structures) to 100 μm (for larger tissue regions). Higher resolution (e.g., 10 μm) enhances detection of metabolic niches but requires balancing data volume and computational load. For instance, neuronal synapse studies demand ≤10 μm resolution, while organ-wide metabolic profiling may prioritize throughput over ultra-high detail.
Reagents and Instruments
Critical tools include:
- Cryostat: Leica CM1950 for precise 12-μm tissue sections.
- Matrix Sprayer: TM-Sprayer for uniform DHB or CHCA coating.
- Mass Spectrometers: High-sensitivity systems like TimsTOF flex ensure robust data acquisition.
Workflow: From Tissue to Insight
Step 1: Tissue Sectioning and Mounting
Tissues are flash-frozen, sectioned, and mounted on conductive slides. Vacuum drying preserves metabolite stability and spatial integrity.
Step 2: Matrix Application
A homogeneous matrix layer is critical for efficient ionization. Parameters like temperature, spray cycles, and solvent composition are optimized to avoid crystallization artifacts.
Step 3: Imaging and Data Acquisition
Laser raster scanning generates pixel-level *m/z* data, which is processed into heatmaps using software like SCiLS Lab. For example, a tumor section might reveal lactate accumulation in hypoxic regions, guiding cancer metabolism studies.

Schematic of MALDI-MSI workflow
Analytical Depth: Beyond Imaging
1. Metabolite Identification
Metabolite identification serves as the cornerstone of spatial metabolomics technology. Through procedures including peak annotation, MS/MS fragmentation, and database matching, metabolites within tissues are identified. This process not only reveals the diversity of metabolites in tissues but also provides foundational data for subsequent spatial distribution analysis. The significance lies in its capacity to unravel metabolic networks within tissues, offering critical insights for disease research and drug development.
_1741593778_WNo_1034d550.webp)
Metabolite Detection (MS2)
2. Spatial Distribution Mapping
This step visually maps the spatial distribution of metabolites across tissues, with color gradients representing relative intensity to localize metabolite-enriched regions. These maps enable researchers to observe distribution patterns and uncover metabolic heterogeneity between tissue regions, delivering vital clues for pathological studies and therapeutic discovery.
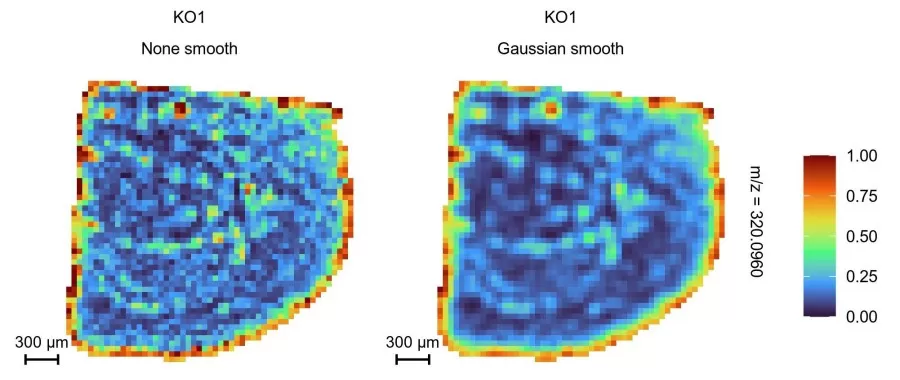
Metabolite spatial distribution
3. Multivariate Data Analysis
(1) Spatial Segmentation Analysis
This approach rapidly partitions regions of interest in mass spectrometry imaging datasets by clustering pixels with similar spectral profiles using clustering algorithms. Color-coded segmentation guides region selection, aiding in the identification of distinct metabolic zones and directing further investigation.
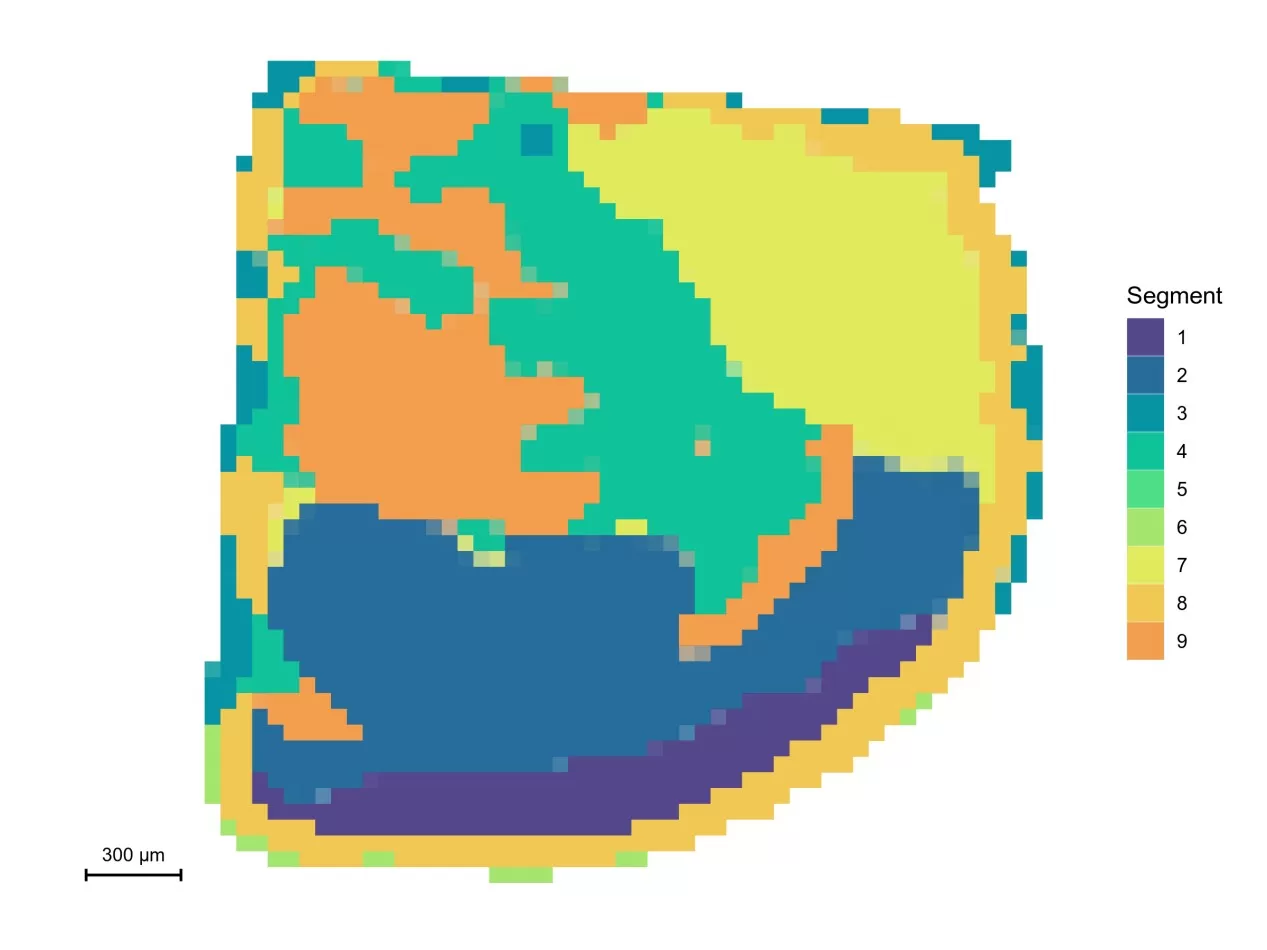
Spatial segmentation
(2) t-SNE and UMAP Analysis
These nonlinear dimensionality reduction algorithms project high-dimensional data into low-dimensional space, visualized as scatter plots where pixels with similar metabolite abundance cluster together. By preserving both local and global data structures, they reveal latent metabolic clustering patterns, serving as powerful tools to decode metabolic organization in biological systems.
(3) Metabolite Co-localization Analysis
Employing Pearson correlation coefficients and Mander’s co-localization coefficients, this method identifies spatial consistency between metabolites, uncovers potential interactions, and constructs co-localization networks to visualize metabolite "social relationships." It illuminates synergistic relationships among metabolites, advancing understanding of complex metabolic processes.
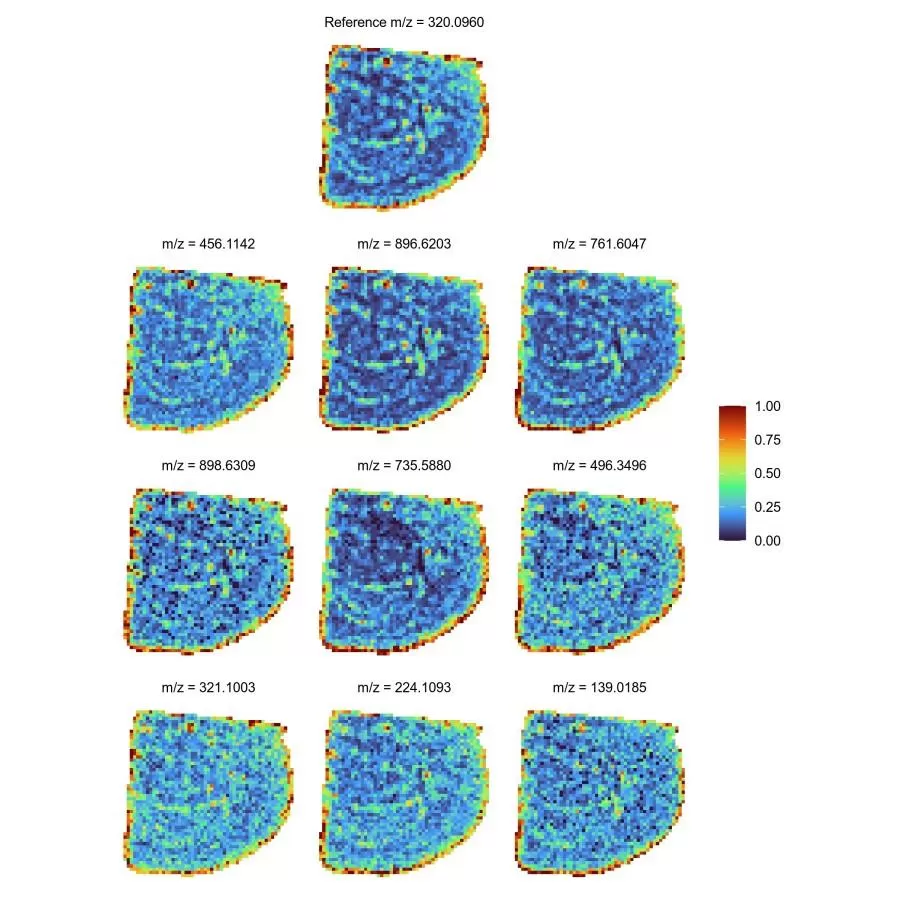
Metabolite Co-localization Spatial Map for top nine Pearson-correlated metabolites
(4) Region of Interest (ROI) Delineation and Relative Quantification
ROIs are defined based on histology, staining results, or spatial segmentation, enabling precise relative quantification of metabolites within specific regions. This step supports accurate inter-regional metabolic comparisons, critical for disease diagnosis and therapeutic evaluation.
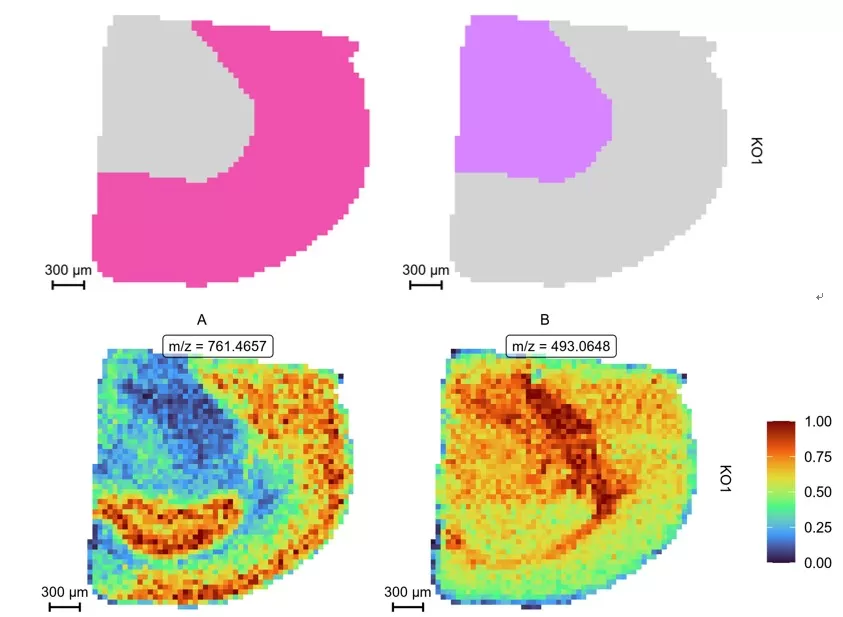
Co-localization analysis of regions of interest
(5) PCA, Cluster Analysis, and Biological Replicate Assessment
Principal component analysis (PCA) simplifies datasets to assess global metabolite distribution patterns, while cluster analysis categorizes samples. Biological replicate consistency is evaluated to ensure data reliability, establishing a robust foundation for downstream analyses.
(6) Differential Metabolite Screening and Visualization
Orthogonal Partial Least Squares-Discriminant Analysis (OPLS-DA), combined with VIP values, p-values, and fold change (FC) criteria, identifies differential metabolites. Subsequent KEGG pathway mapping, functional annotation, and enrichment analysis elucidate biological pathways and metabolic mechanisms underlying phenotypic variations.
Technical Advantages: Why Spatial Metabolomics Stands Out
1. Preserved Spatial Context: Captures metabolite microenvironments lost in bulk analysis.
2. Label-Free Simplicity: Eliminates tagging steps, reducing artifacts and costs.
3. High Sensitivity: Detects low-abundance metabolites (e.g., signaling lipids) with ppm-level accuracy.
4. Versatility: Applicable to plant, animal, and clinical samples, bridging basic research and translational applications.
As noted by Professor Theodore Alexandrov in ‘Nature Metabolism’ (2023), "Spatial metabolomics is transitioning from a niche field to a cornerstone of systems biology." This technology is not just a tool—it’s a paradigm shift, unlocking new dimensions in life science research.
References
1. Alexandrov T. Spatial metabolomics: from a niche field towards a driver of innovation. Nat Metab. 2023 Sep;5(9):1443-1445. doi: 10.1038/s42255-023-00881-0.
2. Buchberger AR, DeLaney K, Johnson J, Li L. Mass Spectrometry Imaging: A Review of Emerging Advancements and Future Insights. Anal Chem. 2018 Jan 2;90(1):240-265. doi: 10.1021/acs.analchem.7b04733.
Read more
Spatial Metabolomics: Transforming Biomedical and Agricultural Research
Spatial Metabolomics Explained: How It Works and Its Role in Cancer Research
MALDI, DESI, or SIMS? How to Choose the Best MSI Techniques for Spatial Metabolomics
How to Prepare Samples for Spatial Metabolomics: The Essential Guide You Need


