Advanced Data Analysis in Spatial Metabolomics
Spatial metabolomics revolutionizes traditional metabolomics by integrating three-dimensional spatial context, revealing not only ‘what’ metabolites are present but also ‘where’ they are localized within tissues. This dual insight is critical for understanding disease mechanisms, developmental processes, and cellular microenvironments. However, the complexity of spatial metabolomic datasets—combining mass spectrometry (MS) data with spatial coordinates—demands robust bioinformatics pipelines to extract actionable insights. This guide explores core analytical techniques in spatial metabolomics, from raw data processing to biological interpretation.
Step-by-Step Workflow for Spatial Metabolomics Analysis
Spatial metabolomics begins with meticulous sample preparation and data acquisition. Below is a streamlined overview of the detection process:
1. Sample Preparation: Tissue sections are mounted on matrix-coated indium tin oxide (ITO) slides, optimized for ionization during MS imaging.
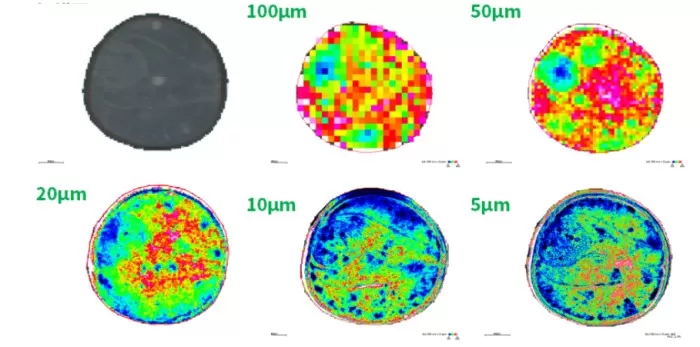
2. Region Selection & Resolution Setup: Regions of interest (ROIs) are defined using instrument software, with imaging resolution adjusted (e.g., 10–100 µm/pixel).
3. Grid Division: The tissue is partitioned into a 2D grid, where each pixel corresponds to a spatial coordinate.
4. Laser Scanning & Ionization: A laser beam scans the grid, desorbing and ionizing metabolites via matrix-assisted laser desorption/ionization (MALDI) or similar techniques.
5. Data Acquisition: A mass spectrometer detects ionized metabolites, generating raw datasets containing mass-to-charge (m/z) ratios, intensity values, and spatial coordinates.
This workflow produces multidimensional datasets that link metabolite identity, abundance, and spatial distribution—a foundation for downstream analysis.
Metabolite Annotation: Decoding Molecular Identity
Raw MS data contains thousands of ‘m/z’ peaks, necessitating precise metabolite identification. Key steps include:
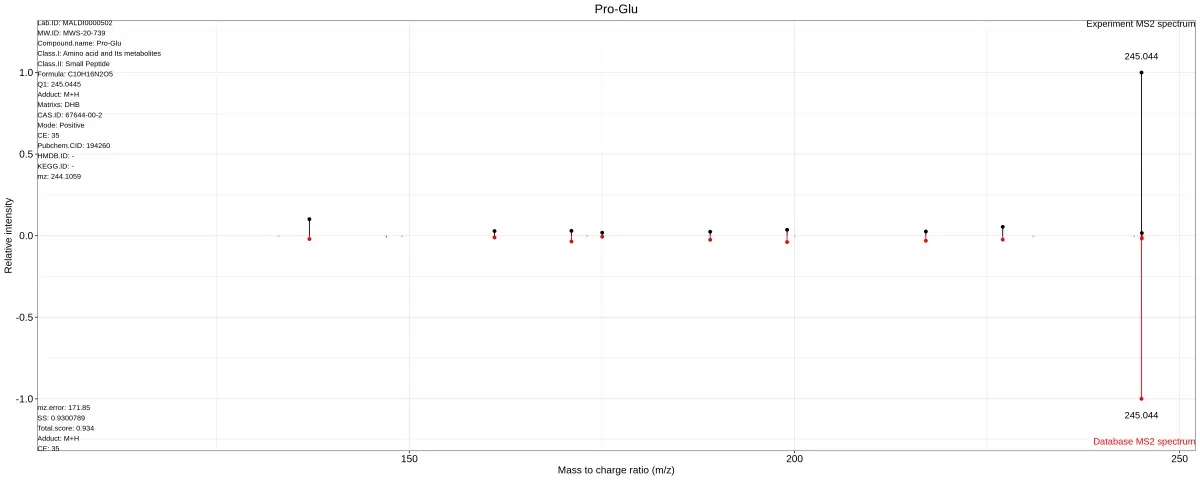
- MS/MS Fragmentation: High-intensity peaks undergo in-tissue fragmentation to generate secondary spectra, matched against public databases (e.g., HMDB, METLIN) or custom libraries.
- Low-Intensity Peaks: For peaks lacking MS/MS data, molecular weights are matched within a predefined error range (e.g., ±5 ppm) to database entries.

Metabolic identification through secondary spectral matching
Visualizing Metabolite Distributions in Spatial Context
Spatial distribution maps are generated by converting ‘m/z’ intensity values into heatmaps. Tools like SCiLS Lab or METASPACE enable:
Data Normalization: Root mean square (RMS) normalization corrects for technical variability.
Heatmap Visualization: Intensity gradients (e.g., blue-to-red scales) highlight metabolite accumulation zones (Figure 2).
Integration with Histology: Overlaying heatmaps with hematoxylin and eosin (H&E)-stained images contextualizes metabolite localization within tissue morphology.

Spatial heatmap of a metabolite
Segmentation & Clustering: Identifying Distinct Metabolic Regions
1) Segmentation Analysis
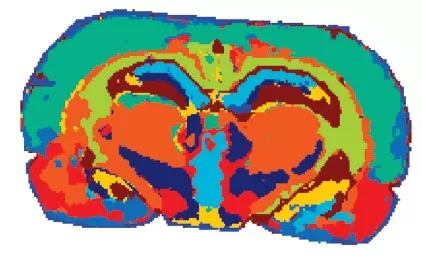
Segmentation groups pixels with similar spectral profiles, revealing distinct metabolic regions. Algorithms like ‘spatially-aware nearest shrunken centroids’ assign colors to clusters, aiding ROI selection. In brain tissue studies, clustering identifies regions enriched in neurotransmitters or lipids, correlating with functional neuroanatomy.

Segmentation analysis of brain tissue
2) Cluster correlation analysis
Inter-cluster distances (e.g., Euclidean or Manhattan) are widely used to quantify metabolic similarity. A distance matrix visualizes relationships between clusters, highlighting antagonistic or synergistic metabolite dynamics.
3) Regional Biomarker Discovery
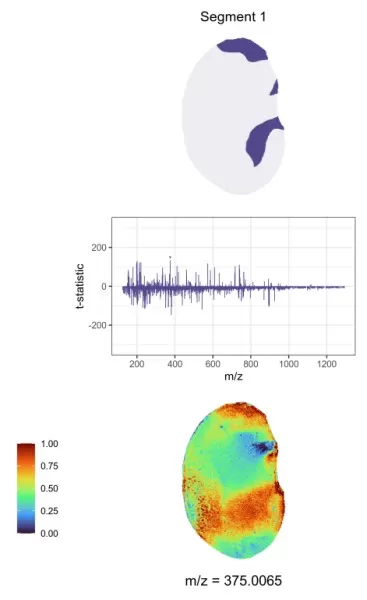
Spatially-aware nearest shrunken centroids analysis computes t-statistics for each target peak within every region, illustrating the relationship between the centroid of each region and the global average mass spectrum. A t-statistic greater than 0 signifies a higher relative content of the target substance in that region, while a value less than 0 indicates a lower content. Values closer to 0 suggest a lesser contribution to region differentiation, whereas larger absolute values denote a greater contribution.

T-statistics and spatial distribution map of regional characteristic metabolites.
Metabolite Co-localization and Network Analysis
1) Co-localization Analysis
Pearson’s correlation (r) and Manders’ coefficients identify metabolites with overlapping spatial distributions. High ‘r’ values (e.g., >0.8) suggest functional interactions, such as enzyme-substrate relationships.
2) Network Analysis
Correlation matrices (|r| ≥ 0.8, P < 0.05) are visualized as networks, where nodes represent metabolites and edges denote significant correlations.
Differential Analysis & Pathway Enrichment
Spatial metabolomics leverages both univariate (e.g., t-tests) and multivariate (e.g., PCA, PLS-DA) statistics to identify differentially abundant metabolites. Key steps:
ROI-Specific Analysis: Compare metabolite levels across ROIs (e.g., tumor core vs. margin).
KEGG Pathway Enrichment: Annotate differential metabolites to pathways (e.g., "Fatty Acid Biosynthesis"), prioritizing those with spatial enrichment.
Prioritizing Spatial Context in Metabolomics
Spatial metabolomics transcends traditional "grind-and-find" approaches by preserving the architectural context of metabolites. Emphasizing ‘where’ molecules localize—not just ‘what’ they are—unlocks deeper insights into tissue heterogeneity, disease mechanisms, and therapeutic targets. Future integration with spatial transcriptomics and proteomics will further illuminate the multidimensional logic of life.
References
Alexandrov T. Spatial metabolomics: from a niche field towards a driver of innovation. Nat Metab. 2023 Sep;5(9):1443-1445. doi: 10.1038/s42255-023-00881-0.
Read more
- Spatial Metabolomics: Transforming Biomedical and Agricultural Research
- Spatial Metabolomics Explained: How It Works and Its Role in Cancer Research
- MALDI, DESI, or SIMS? How to Choose the Best MSI Techniques for Spatial Metabolomics
- How to Prepare Samples for Spatial Metabolomics: The Essential Guide You Need
- Unlocking Precision in Spatial Metabolomics: Essential Detection Parameters for Cutting-Edge Research
Next-Generation Omics Solutions:
Proteomics & Metabolomics
Ready to get started? Submit your inquiry or contact us at support-global@metwarebio.com.


