Comprehensive Guide to ROC Curve: Theory, Applications, and Implementation
The Receiver Operating Characteristic (ROC) curve is a fundamental tool in statistical analysis and machine learning, originally developed during World War II for radar signal detection. Engineers sought methods to distinguish enemy aircraft signals (true positives) from background noise (true negatives). By the 1950s, this concept was adopted in psychology and medicine to evaluate diagnostic test accuracy. Today, ROC curves are indispensable in fields ranging from clinical decision-making to machine learning model evaluation, particularly for tasks involving imbalanced datasets or probabilistic classification.
Key Definitions
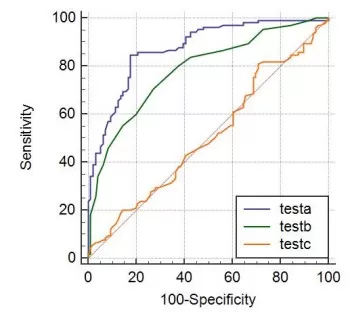
ROC Curve: A graphical plot that illustrates the diagnostic ability of a binary classifier by varying discrimination thresholds.
TPR = TP/(TP + FN)
FPR = FP/(FP + TN)
AUC (Area Under the Curve): A scalar value between 0 and 1 that quantifies the model’s overall ability to distinguish classes.
- AUC = 0.5: Random guessing (diagonal line).
- AUC > 0.9: Excellent discriminatory power (curve hugs the top-left corner).
A curve closer to the top-left corner indicates superior model performance. The diagonal line represents a classifier with no discriminative capacity (e.g., random guessing).
Applications of ROC Curves
1. Model Evaluation
ROC curves enable direct comparison of classifiers under varying thresholds or class distributions. For example, in imbalanced datasets (e.g., rare disease detection), ROC analysis provides a robust metric unaffected by skewed class ratios.
2. Threshold Optimization
The optimal threshold balances sensitivity and specificity based on domain requirements:
Clinical Diagnostics: Prioritize high sensitivity to minimize false negatives (e.g., cancer screening).
Spam Detection: Prioritize high specificity to reduce false positives (e.g., avoiding legitimate emails marked as spam).
3. Robustness Analysis
ROC curves are resilient to changes in class distribution, making them ideal for evaluating model stability across diverse populations or experimental conditions.
Step-by-Step Implementation in R
library(pROC)
library(ggplot2)
# Generate sample data
set.seed(42)
n <- 1000
data <- data.frame(
y_true = sample(c(0, 1), n, replace = TRUE)
)
# Generate predicted probabilities that are closer to the true labels
# Here we assume a higher probability for the positive class
data$y_score <- ifelse(data$y_true == 1, runif(n, 0.8, 1), runif(n, 0, 0.2))
# Calculate the ROC curve
roc_obj <- roc(data$y_true, data$y_score)
# Calculation of AUC values
auc_value <- auc(roc_obj)
# Creating a data frame for the ROC curve
roc_data <- data.frame(
FPR = roc_obj$specificities,
TPR = roc_obj$sensitivities
)
# Plotting ROC curves using ggplot2
roc_plot <- ggplot(roc_data, aes(x = 1 - FPR, y = TPR)) +
geom_line(color = "darkorange", size = 1) +
labs(
x = "False Positive Rate",
y = "True Positive Rate",
title = paste("ROC Curve (AUC =", round(auc_value, 2), ")")
) +
theme_classic()
ggsave("roc_curve.pdf", plot = roc_plot, device = "pdf", width = 8, height = 6)

ROC Curve
Applications of ROC Curves
In a study on early-stage lung cancer, researchers evaluated a panel of 20 serum proteins using ROC analysis. A protein combination achieved AUC = 0.92, demonstrating exceptional diagnostic accuracy. Threshold optimization (Youden’s index) balanced sensitivity (85%) and specificity (88%), minimizing both missed diagnoses and unnecessary biopsies.
ROC curves are a versatile tool in biological research, playing a critical role in disease diagnosis, genomics, proteomics, and drug discovery. In disease diagnosis, ROC analysis evaluates the diagnostic utility of biomarkers, such as blood protein levels or gene expression, to distinguish diseased from healthy individuals. Additionally, in drug discovery, ROC curves are used to assess the predictive performance of compound-target interactions during high-throughput screening, enabling researchers to optimize hit selection and reduce experimental costs. By providing a quantitative measure of classification performance, ROC curves facilitate data-driven decision-making across these diverse applications, ultimately advancing precision medicine and therapeutic development. ROC curves remain a cornerstone of model evaluation and decision-making across scientific disciplines. By mastering their interpretation and implementation, researchers can enhance diagnostic accuracy, optimize experimental workflows, and drive innovations in precision medicine.
Read more
- Understanding WGCNA Analysis in Publications
- Deciphering PCA: Unveiling Multivariate Insights in Omics Data Analysis
- Metabolomic Analyses: Comparison of PCA, PLS-DA and OPLS-DA
- WGCNA Explained: Everything You Need to Know
- Harnessing the Power of WGCNA Analysis in Multi-Omics Data
- Beginner for KEGG Pathway Analysis: The Complete Guide
- GSEA Enrichment Analysis: A Quick Guide to Understanding and Applying Gene Set Enrichment Analysis
- Comparative Analysis of Venn Diagrams and UpSetR in Omics Data Visualization
Next-Generation Omics Solutions:
Proteomics & Metabolomics
Ready to get started? Submit your inquiry or contact us at support-global@metwarebio.com.


