Mastering Pearson Correlation: A Step-by-Step Guide to Analyzing Data Relationships
In the world of data analysis, understanding relationships between variables is crucial for deriving meaningful insights. One of the most widely used statistical methods for this purpose is Pearson correlation analysis, which measures the strength and direction of a linear relationship between two continuous variables. Whether you're working in research, healthcare, or any data-driven field, mastering this technique can significantly enhance your analytical skills.
In this guide, we will walk you through the steps of performing Pearson correlation analysis, from obtaining suitable datasets to interpreting the results. We’ll be utilizing the Metware Cloud platform, a powerful tool that offers advanced features for statistical analysis, including data visualization and processing. By the end of this tutorial, you'll have a solid understanding of how to effectively apply Pearson correlation analysis in your projects and leverage the capabilities of the Metware Cloud platform to optimize your results. Let’s dive in!
What is Pearson Correlation Coefficient?
The Pearson correlation coefficient was introduced in 1896 by British statistician Karl Pearson to measure to measure the strength and direction of the linear relationship between two continuous variables. Pearson's work was inspired by Francis Galton, who studied inheritance and statistical correlations. By refining Galton's approach, Pearson developed a more precise method for quantifying the strength of these relationships. It quantifies how well the variation in one variable can be explained by the variation in another variable. The result of this analysis is called the Pearson correlation coefficient (r), which ranges from -1 to 1.
- r = 1: A perfect positive linear relationship, meaning as one variable increases, the other also increases proportionally.
- r = -1: A perfect negative linear relationship, meaning as one variable increases, the other decreases proportionally.
- r = 0: No linear relationship between the variables.
The Pearson correlation coefficient is calculated using the following formula:

Where:
- x and y are the two variables.
- i is the number of data points.
What Are the Requirements for Pearson Correlation?
Pearson correlation analysis requires the following five assumptions to be met:
- Both variables must be continuous.
- The two variables should be paired and derived from the same subjects.
- A linear relationship should exist between the two continuous variables.
- There should be no significant outliers between the two variables.
- Both variables should follow an approximately normal distribution.
How to Conduct Pearson Correlation Analysis
Step 1: Obtain a suitable dataset, define the analysis goal, and propose hypotheses
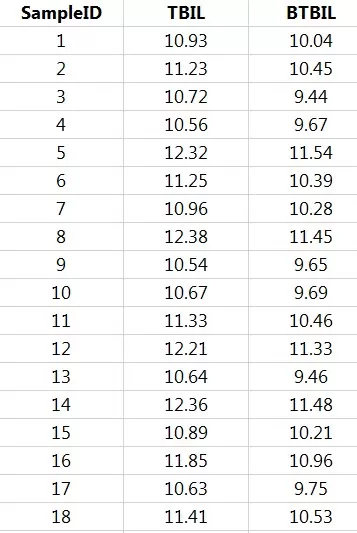 Dataset:
This case involves measurements from 18 newborns with jaundice, recording their total serum bilirubin (TBIL) and sternal bilirubin (BTBIL) levels in mg/dl. The data provided is hypothetical.
Goal:
The objective is to determine whether there is a linear relationship between the two bilirubin measurements in newborns with jaundice.
Hypotheses:
Null Hypothesis (H0): There is no linear correlation between total serum bilirubin and sternal bilirubin in newborns with jaundice.
Alternative Hypothesis (H1): There is a linear correlation between total serum bilirubin and sternal bilirubin in newborns with jaundice.
Step 2: Evaluate the dataset against the five Pearson correlation assumptions
The dataset must satisfy five key conditions for Pearson correlation analysis: continuity, paired data from the same subjects, linear relationship, normal distribution, and absence of significant outliers.
Continuity and paired data:
From the dataset, it is evident that both variables (TBIL and BTBIL) are continuous and are paired measurements taken from the same subjects, satisfying the first two conditions.
Linear relationship:
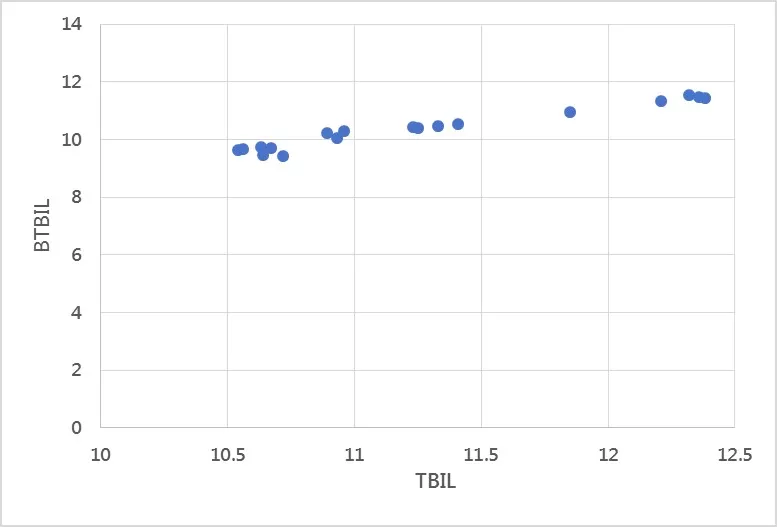
To assess whether a linear relationship exists between the two variables, a scatter plot can be generated using Excel. The scatter plot of TBIL and BTBIL shows that the data points are approximately aligned along a straight line, indicating a linear relationship between the two variables.
Outlier detection:
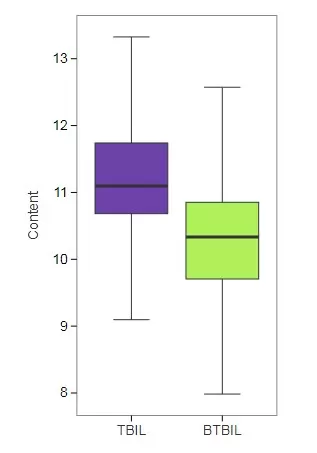
To identify any significant outliers, a box plot can be generated using the "Advanced Box Plot" tool on the Metware Cloud platform. The box plot reveals no significant outliers in the dataset. (If your actual dataset contains outliers or missing values, you can use the "Missing & Outlier Value Processing" tool on the Metware Cloud platform to preprocess the data.)
Normality check:
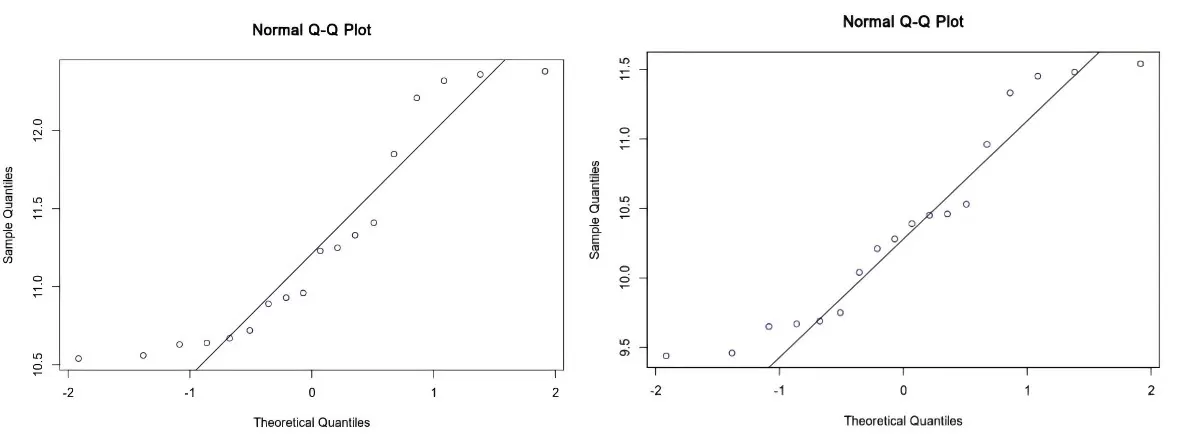
To determine whether the two variables follow a normal distribution, we can use the Metware Cloud platform's "Normal Distribution Test" tool to create a Q-Q plot. The Q-Q plots for TBIL (left) and BTBIL (right) show that the data points are closely aligned along the diagonal, suggesting that both variables are approximately normally distributed.
Step 3: Perform Pearson correlation analysis
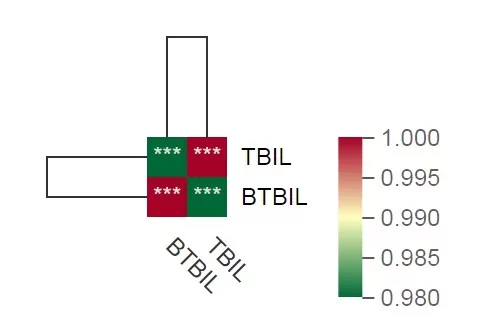 After confirming that the two datasets meet the five prerequisite conditions, we can proceed with the Pearson correlation analysis. This can be performed using the "Advanced Correlation Clustering Heatmap" tool on the Metware Cloud platform. As shown in the analysis results, the levels of TBIL and BTBIL are highly correlated, with correlation coefficients (r) close to 1 and p-values less than 0.001, indicating a statistically significant relationship.
Next-Generation Omics Solutions:
Proteomics & Metabolomics
Ready to get started? Submit your inquiry or contact us at support-global@metwarebio.com.


