Multi-Omics Association Analysis (II): Association Analysis of Proteomics and Metabolomics
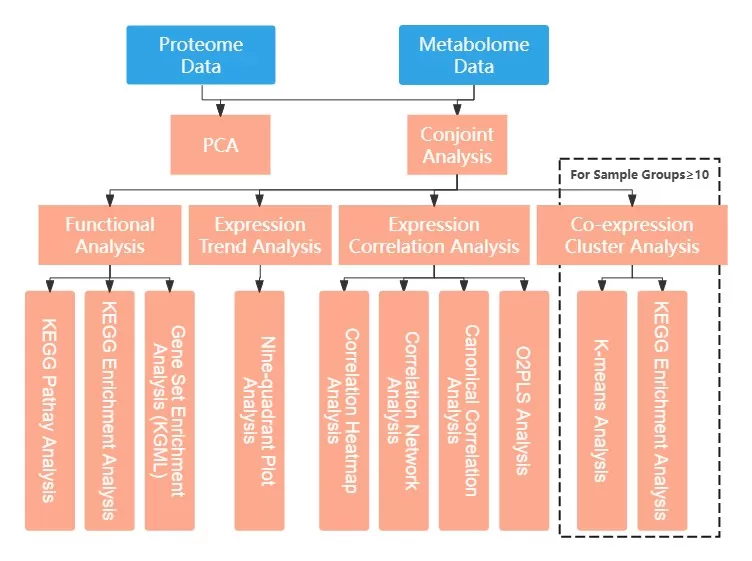
1. Combined Analysis Approach for Proteomics and Metabolomics
In the quest to uncover the mysteries of life, proteomics and metabolomics are two powerful tools. Proteomics allows us to gain insights into the expression and functional patterns of proteins at specific moments, serving as a "logbook" of cellular activities that captures every detail of life processes. Metabolomics, on the other hand, focuses on the dynamic changes of all low-molecular-weight metabolites within an organism. This field is closely tied to our health phenotypes and is key to understanding how the body responds to environmental changes. When these two disciplines are combined, we can not only observe how proteins influence metabolite expression but also understand how metabolites, in turn, regulate protein expression. This bidirectional interaction provides us with a comprehensive framework for exploring the molecular mechanisms of diseases and how external stimuli affect our cells. Through the joint analysis of proteomics and metabolomics, we can more clearly reveal the complex relationships between metabolites, enzymes, and genes. This not only aids in understanding the delicate balance of life activities but also offers new perspectives for disease diagnosis and treatment.
2. Display of Selected Analysis Results
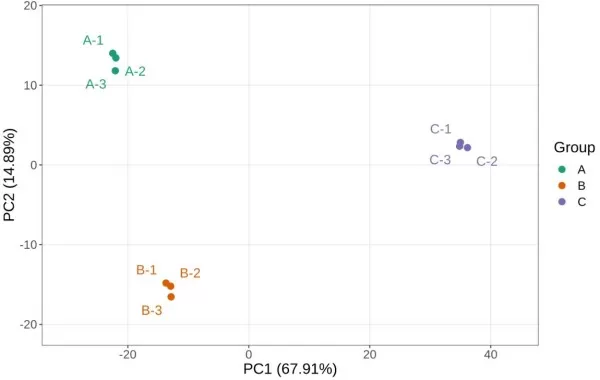
1) Principal Component Analysis (PCA) Results of Two Omics
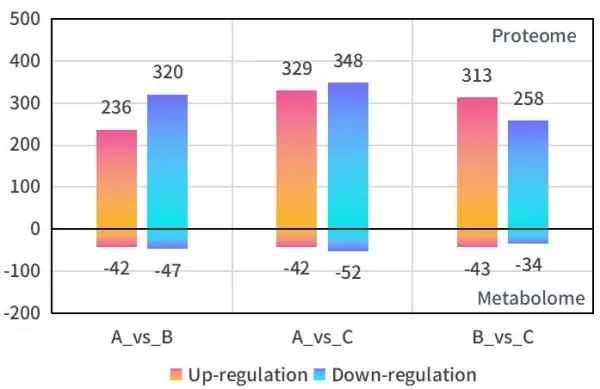
2) Statistics on Differential Proteins and Metabolites
3) KEGG Database Analysis for Pathway Enrichment
The comparison of KEGG enrichment analysis results could be obtained from both omics, selecting significantly enriched pathways for further study.
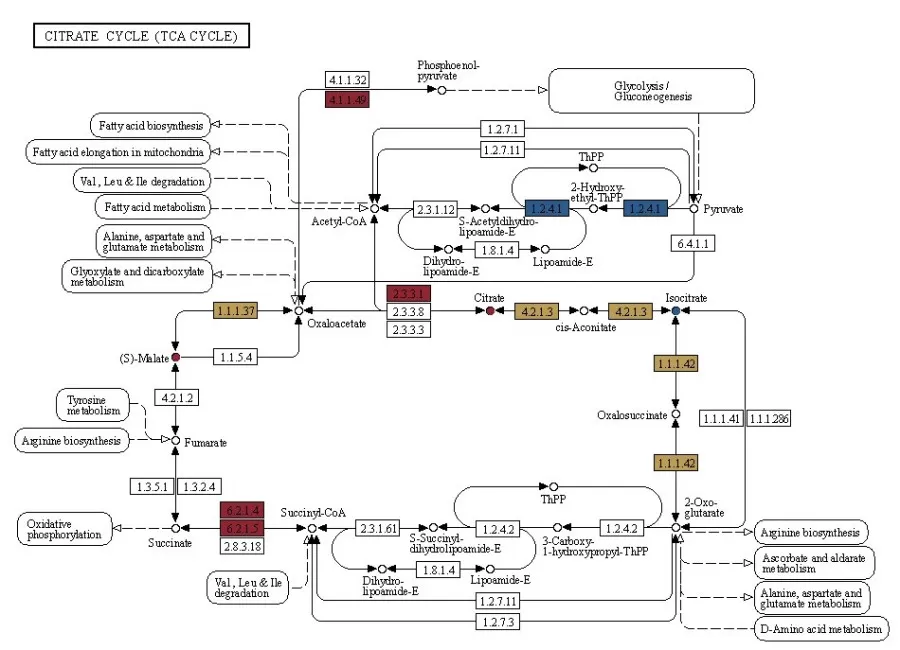
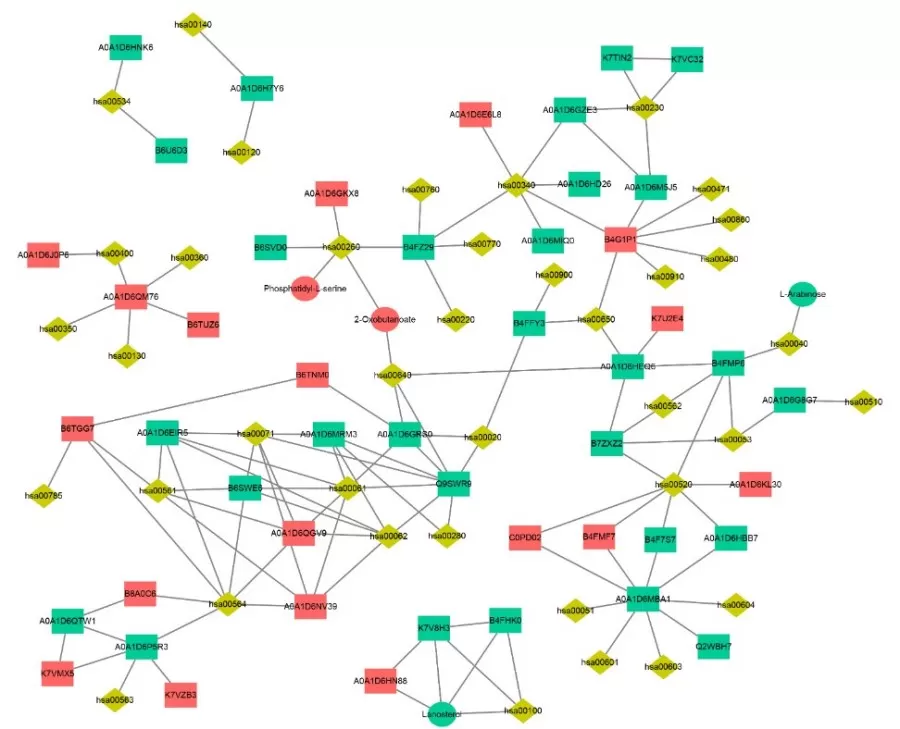
KGML (KEGG Markup Language) serves as an alternative format for KEGG pathway maps, containing both the relationships of graphical objects within KEGG pathways and information on direct homologous genes from the KEGG GENES database. This information allows for the construction of interaction networks between genes, gene products, and metabolites. By integrating the KGML files of all pathways, we can systematically investigate the network relationships among pathways, genes, gene products, and metabolites.
4) Expression Correlation Analysis: Univariate and Multivariate Approaches
Univariate Correlation Analysis and Visualization: This analysis assesses whether a statistical correlation exists between two variables, calculating the correlation coefficients between metabolites and proteins. Different visualization approaches of these correlation coefficients can assist researchers in rapidly identifying biomarkers associated with diseases.
Multivariate Correlation Analysis and Visualization: This analysis examines whether statistical correlations exist among three or more variables. Such analyses help us understand the complex relationships between multiple variables and how they collectively influence one or more outcome variables.
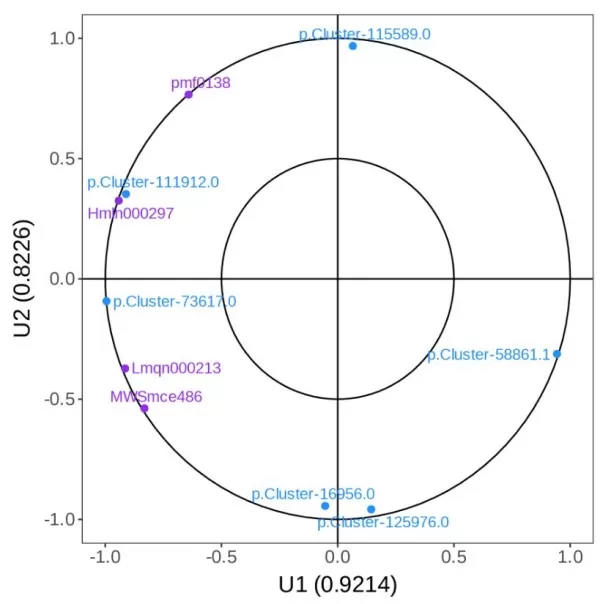 i) Canonical Correlation Analysis (CCA): This multivariate statistical method utilizes composite indicators (canonical variables) to reflect the overall correlation between two sets of indicators (variables). The horizontal and vertical axes represent the simple correlation coefficients between different omics and the canonical variables U1 and U2, with different colors indicating different omics. The graph is divided into four quadrants, where points farther from the origin within the same quadrant indicate stronger associations with the canonical variables, while points closer together indicate similar associations with the canonical variables.
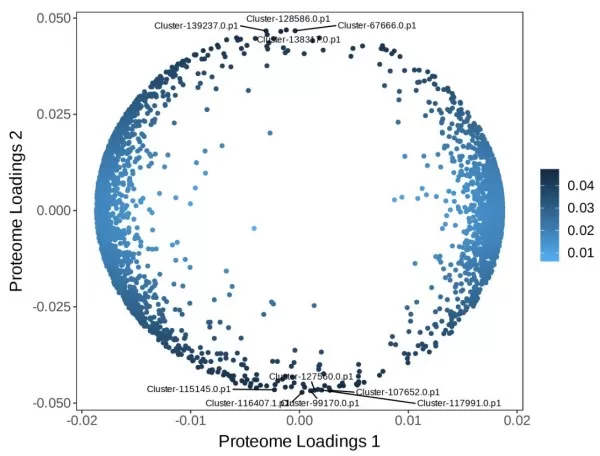
ii) Two-Way Orthogonal Partial Least Squares (O2PLS): This method starts from the overall relationships between two omics datasets (multivariate-to-multivariate) and performs bidirectional modeling to predict data sets within the two matrices that are potentially associated. This approach aims to objectively describe whether an association trend exists between the two datasets while minimizing false positive associations, making it particularly suitable for preliminary screening. The plot shows the loadings of the metabolomics and proteomics, respectively; the horizontal and vertical axes represent the loading values of each variable with respect to the first and second components. The deeper the color of the scatter points, the greater the degree of association with the other omics. The top 10 influential substances are highlighted in the plot.
5) Co-Expression Clustering Analysis: Understanding Jointly Regulated Genes
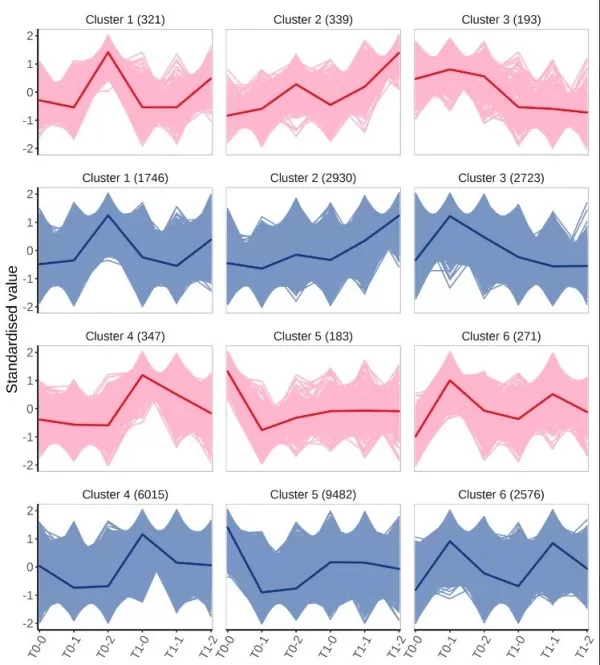
Co-expression clustering analysis is a commonly used bioinformatics method applied to expression data from two omics. It involves clustering based on expression patterns across different sample groups and subsequently annotating the functional aspects of the clusters to help identify groups that are jointly regulated under similar conditions, thus inferring their functions and interactions in biological processes. For the K-means analysis plot, the horizontal axis represents sample grouping, while the vertical axis shows the normalized relative abundance of variables. Pink and blue colors denote metabolomics and transcriptomics, respectively, with "Cluster n" representing the n-th cluster with similar expression trends, and the number in parentheses indicating the count of variables within that cluster
Next-Generation Omics Solutions:
Proteomics & Metabolomics
Ready to get started? Submit your inquiry or contact us at support-global@metwarebio.com.


