microbeMASST: The Ultimate Guide to Identifying Microbial Metabolites
Understanding microbial metabolites is key to unlocking the mysteries of microbial ecosystems. However, challenges like incomplete databases and low identification accuracy have left many metabolites uncharacterized.
In early 2024, Nature Microbiology published a groundbreaking study titled "microbeMASST: A Taxonomically Informed Mass Spectrometry Search Tool for Microbial Metabolomics Data. (article resource)" This study introduced microbeMASST, a powerful tool designed to address the limited annotation of microbial metabolites in untargeted metabolomics experiments. Despite its potential, many researchers have found it challenging to use. That's why MetwareBio's bioinformatics team has created this detailed guide to help you get the most out of microbeMASST!
What is microbeMASST?
MicrobeMASST is a specialized version of MASST (Mass Spectrometry Analysis and Sharing Technology) that allows users to search one or more MS/MS spectra against a reference database of metabolites from single bacterial and fungal cultures. This data is collected and made publicly available on GNPS-Massive (as of July 2022). Users can search for both known and unknown MS/MS spectra.
How to Use microbeMASST
Input Methods
 Method 1: Users can input any MS/MS spectrum into MASST. If you’re searching for known molecules already in the GNPS library, enter the spectrum ID for the molecule (see Figure 1). As of January 2023, the GNPS library contains about 600,000 spectra.
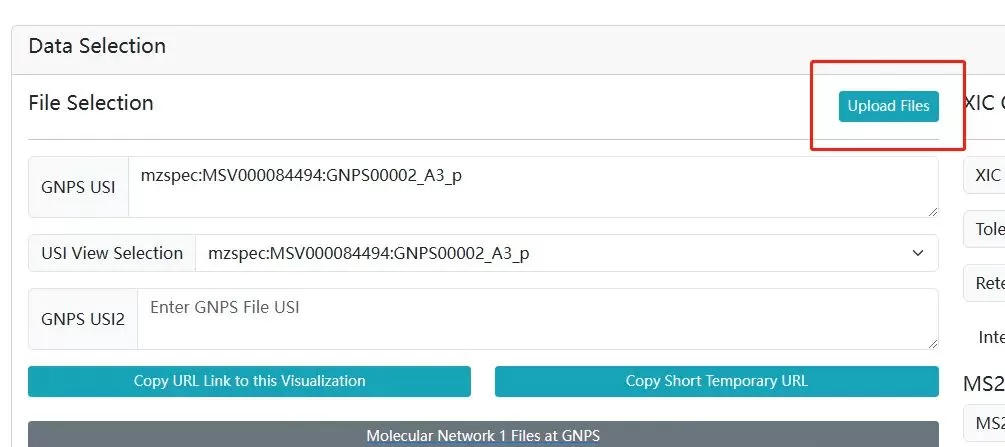
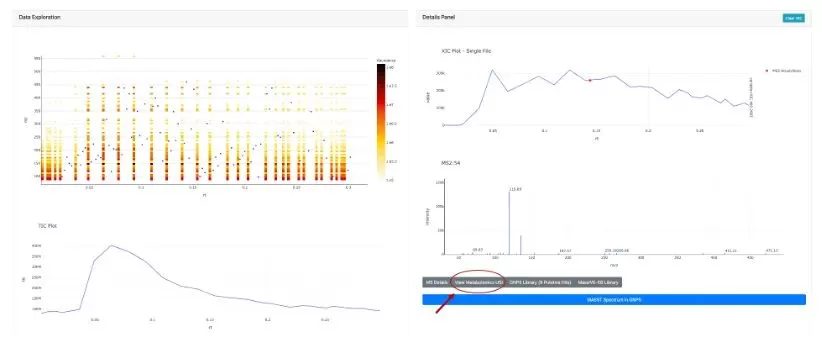
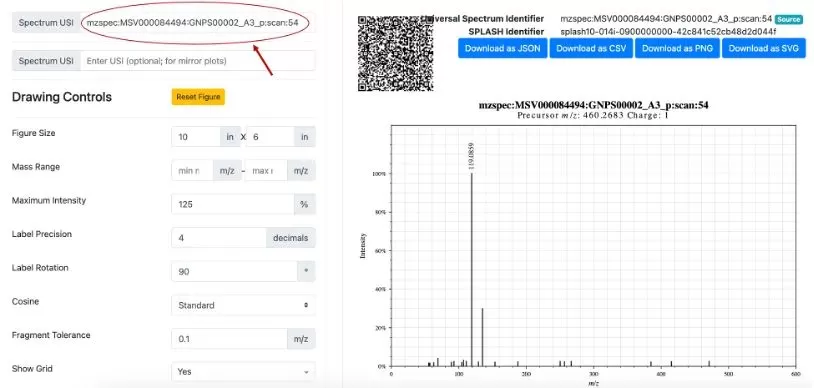
Another method is by using Universal Spectrum Identifiers (USI) through data uploaded to the Massive website (a mass spectrometry data exchange platform) and searching on the GNPS Dashboard. Users can upload spectrum files (see Figures 2A-2D), and once uploaded, select retention times (RT), view the Spectrum USI, and use it in microbeMASST for searching.
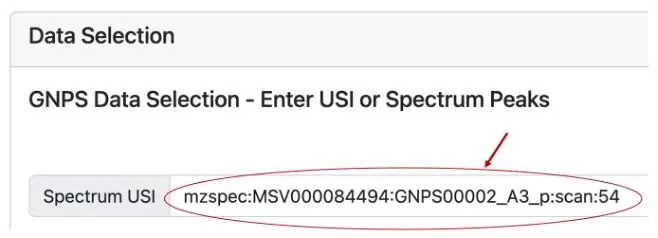
Method 2: Users can manually input a list of MS/MS fragment ion m/z ratios and their intensities to predict the microbial source of the spectra (see Figure 3). The precursor ion’s m/z must be specified, but the charge field usually does not need to be filled in.

Search Settings
Default search settings are provided (see Figure 4). These include precursor ion m/z, fragment ion tolerance (PM Tolerance), cosine similarity threshold (Cosine Threshold), and a minimum of 3 matching fragment peaks. Users can perform analog searches (default is off) and specify the mass range for analog search.
If you’re searching with a USI, click "Search microbeMASST by USI." If you’re using fragment ion m/z ratios and their intensities, click "Search microbeMASST by Spectrum Peaks." You can share your search settings with others by clicking "Copy Link."

Note: Enter the precursor ion m/z in the "Precursorm/z" field, then copy the fragment ion information into the "Spectrum peaks" field. Leave the charge field empty, use default settings, and click "Search microbeMASST by Spectrum Peaks." If no results are shown, try multiple times. If results are still not found, it indicates the substance or its similar substances are not included in microbeMASST.
Understanding microbeMASST Results
The primary output of a microbeMASST search is an interactive taxonomy tree (see Figure 5), displaying the species-level classification of bacteria or fungi corresponding to the metabolite of interest. By default, the tree shows information down to the species level. You can modify the display level, and the "Minimum matches" parameter represents the minimum number of matching samples needed to confirm the species. It’s recommended to use the default setting of 1, as microbeMASST is a discovery tool and doesn't always provide definitive results. You can display the full tree by changing the setting from "Matched" to "Full."

Hovering over any node on the tree reveals species and sample information (see Figure 6), including taxonomy names, NCBI ID, classification levels, the number of MS/MS spectra matched to that species, and the frequency of occurrence, visualized as a pie chart.

Clicking the "Library matches" tab displays a list of matching metabolites found in the GNPS library (see Figure 7). In this example, the MS/MS spectrum for phenylalanine-cholic acid (Phe-CA) matched almost identically to a reference spectrum in the GNPS library. The GNPS Suspect Library was also used for this MS/MS search, enhancing annotation rates for unknown metabolites. However, Suspect Library annotations are predictions and not as reliable as those matched directly with classic libraries. You can copy or export the result table to Excel.

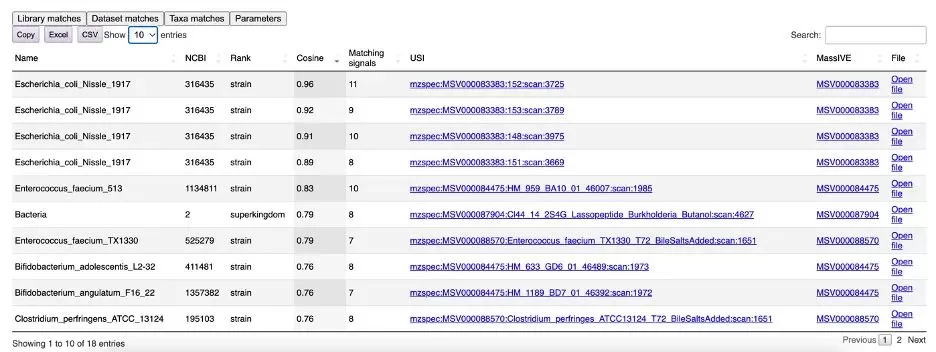
The "Dataset matches" tab contains a summary table of all matching samples (see Figure 8). Here, you can find taxonomy names, NCBI IDs, classification levels, and the number of matching fragments. When searching MS/MS spectra from GNPS-Massive using USI, you can view the mirror plot of fragment matches through the links in the USI column.
Finally, the "Taxa matches" tab lists all matching taxa at every classification level (see Figure 9). In this example, of the 44,836 bacterial samples in microbeMASST, phenylalanine-cholic acid was found in 18 samples, with a frequency of 0.0004. However, in the case of Bifidobacterium adolescentis samples, Phe-CA was found in 4 out of 15 samples, with a frequency of 0.2667.

Conclusion
microbeMASST is a powerful tool for decoding microbial metabolites, offering taxonomically informed searches to better understand the microbial origins of these compounds. This guide will help you get the most out of microbeMASST in your metabolomics research.


