Data Analysis in Metabolomics Biomarker Research-Metabolites Function Analysis
Metabolomics Biomarker Series Article Catalog:
1. Unlocking Biomarkers: A Guide to Vital Health Indicators
2. Metabolomics and Biomarkers: Unveiling the Secrets of Biological Signatures
3. Choosing the Right Study Design for Metabolomics Biomarker Discover
4. Metabolomics Biomarker Screening Process
5. Identifying the Right Samples: A Guide to Metabolomics Biomarker Research
6. Data Normalization in Metabolomics Biomarker Research
7. Data Cleaning in Metabolomics Biomarker Research
8. Data Analysis in Metabolomics Biomarker Research
9. Unveiling Biomarkers: Differential Metabolite Screening in Metabolomics Research
10. Data Analysis in Metabolomics Biomarker Research-Biomarker Screening
11. Data Analysis in Metabolomics Biomarker Research-Biomarker Evaluation
Welcome back to our detailed series on metabolomics biomarker research. In our recent discussions, we focused on the rigorous process of biomarker performance evaluation. This essential step ensures that our identified biomarkers are reliable, sensitive, and specific, meeting the high standards required for clinical or research applications. However, evaluating performance is not the final step in our journey.
Having a key biomarker screened and validated does not mark the end of our research. The next crucial phase involves understanding why a particular metabolite is critical for prediction or diagnosis. This requires delving into the function of the metabolite to explain the biological processes underlying the observed phenotypes. By exploring the roles and pathways associated with these metabolites, we can gain deeper insights into their significance and how they influence health and disease.
In the upcoming blog, we will shift our focus to metabolite function analysis. We will explore various methods to investigate the biological roles of these metabolites, helping us to better understand their contributions to the phenotypes we observe. This analysis not only enhances our comprehension of the biomarkers themselves but also provides a more comprehensive picture of the biological processes at play.
1. KEGG functional annotation and enrichment analysis
The Kyoto Encyclopedia of Genes and Genomes (KEGG) database helps researchers study genes, expression information, and metabolite content as a whole network. As the main public database on pathways, the KEGG database provides integrated metabolic pathway (including the metabolism of carbohydrates, nucleotides, amino acids, etc., and biodegradation of organic substances) queries. It not only provides all possible metabolic pathways but also provides comprehensive annotations on enzymes catalyzing each step of the reaction and contains amino acid sequences, links to the PDB database, etc. It is a powerful tool for analyzing the metabolism in organisms and for metabolic network studies.
1.1 Annotation of metabolite functions
In organisms, metabolites interact with each other to form different pathways. Therefore, by first annotating all of the metabolites detected by using the KEGG database (Kanehisa et al., 2000) and then highlighting the metabolic pathways with differential metabolites, we can find out which pathways are specifically perturbed.
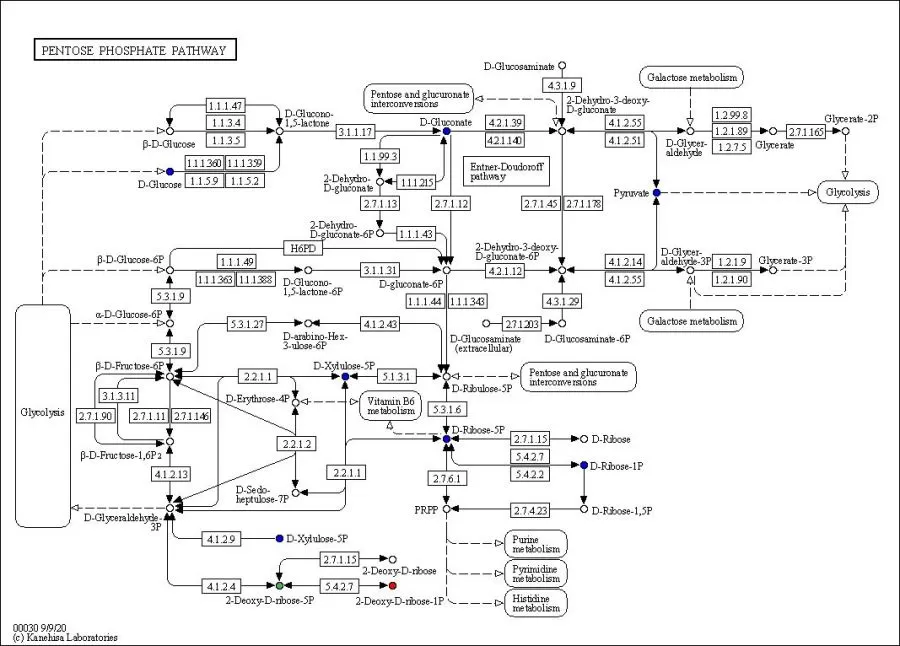
Let's take the pentose phosphate pathway in the above figure as an example. In the figure, 4.3.1.9 indicates the enzyme; the number in the box indicates the EC number; the small circle indicates the metabolite; the red color means that the metabolite level was significantly up-regulated in the experimental group; the blue color means that the metabolite was detected but did not change significantly; and the green color means that the metabolite level was significantly down-regulated in the experimental group.
1.2 KEGG enrichment analysis of differential metabolites
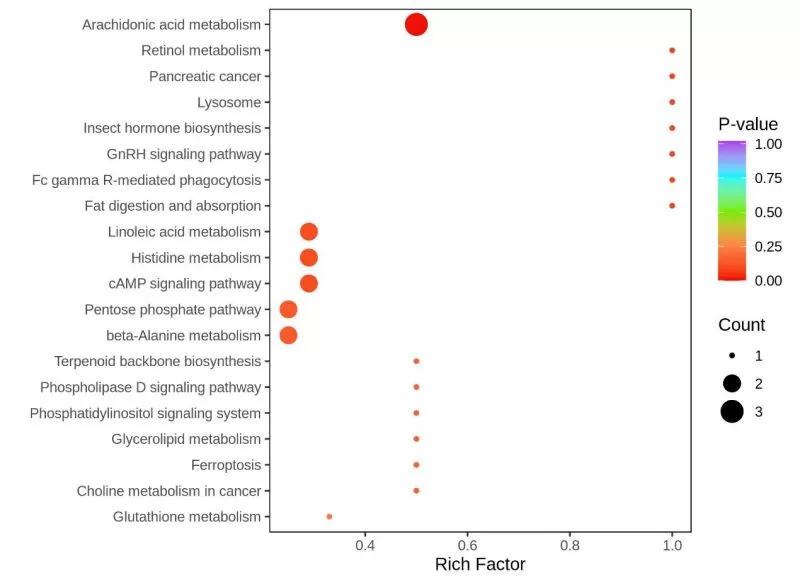 After metabolite annotation is complete, KEGG pathway enrichment analysis is usually performed next based on differential metabolite results.
In this enrichment plot, the horizontal coordinates indicate the rich factor of each KEGG pathway, where the rich factor is the ratio of the number of differential metabolites in the corresponding pathway to the total number of metabolites annotated to that pathway - the larger the rich factor, the greater the enrichment extent. The size of the dots indicates the number of differential metabolites enriched to the corresponding pathway. The color of the dot indicates the P-value, i.e., hypergeometric test P-value; the smaller the P-value (P<<0 05), the more statistically significant the KEGG pathway enrichment. Therefore, the metabolic or signaling pathways of interest and the differentially expressed metabolites that significantly affect these pathways can be selected for subsequent biological experiments or mechanism studies by combining the above three factors.
1.3 Analysis of overall changes in KEGG metabolic pathways
The overall changes in KEGG metabolic pathways are usually visualized by differential abundance score plots. The differential abundance score (DA score) is a pathway-based method for analyzing metabolite changes. The DA score captures the overall change of all metabolites in a given pathway and is calculated as follows:

The top 20 pathways in terms of P-value ranking are usually selected and displayed from smallest to largest to plot the DA score.
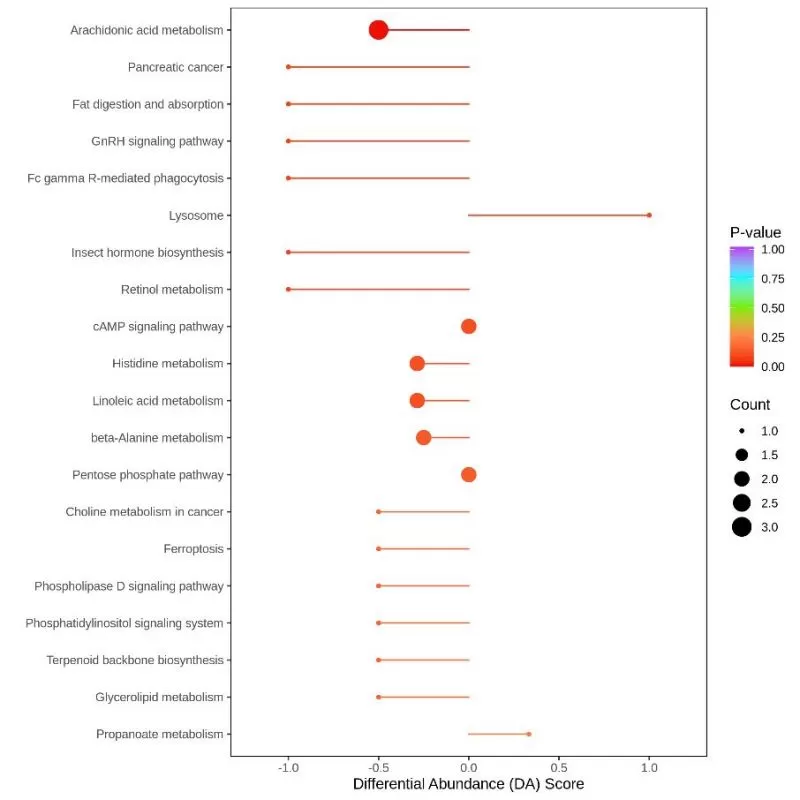 In this graph, the vertical coordinate indicates the name of the differential pathway (sorted by P-value), and the horizontal coordinate indicates the DA score. The DA score reflects the overall change of all metabolites in the metabolic pathway. A DA score of 1 indicates a trend of up-regulation of the expression of all identified metabolites in the pathway, while a score of 1 indicates a trend of down-regulation of the expression of all identified metabolites in the pathway. The length of the line segment indicates the absolute value of the DA Score. The size of the dot at the endpoint of the line segment indicates the number of differential metabolites in that pathway. If the dot is located to the left of the center axis and the line segment is longer, it means that the overall expression in the pathway tends to be more down-regulated; if the dot is located to the right of the center axis and the line segment is longer, it means that the overall expression in the pathway tends to be more up-regulated. By using this analysis, we can visualize the overall changing trend of a certain pathway, and it can also assist us in screening key metabolic pathways.
2. HMDB functional annotation and enrichment analysis
HMDB is a widely used database that collects more than 40,000 endogenous metabolites and more than 5,000 proteins (DNAs) associated with them. This database not only provides links to exogenous databases (e.g., KEGG, Metlin, Biocyc, etc.) but also supports the search of mass spectra and NMR spectra. The HMDB's sub-database SMPDB also provides detailed information on human metabolic pathways, metabolic disease pathways, metabolite signaling, and drug activity pathways. However, since SMPDB only opens the image download of primary pathways to the public, only pathway annotations and enrichment analyses of these pathways can be carried out at present.
2.1 Annotation of metabolite functions
Metabolite annotations based on the HMDB database would be more graphic and vivid than those based on the KEGG database. Information on the sites where metabolic reactions take place (e.g., cytoplasm, mitochondria, etc.), key enzymes, structural formulas of metabolites, and changes in ATP during the reaction are all marked in the figure.
The squares in the figure represent the metabolites, with red indicating that the metabolite level was significantly up-regulated in the experimental group, gray representing that the metabolite was detected but did not change significantly, and green indicating that the metabolite level was significantly down-regulated in the experimental group.
2.2 Annotation of metabolite functions
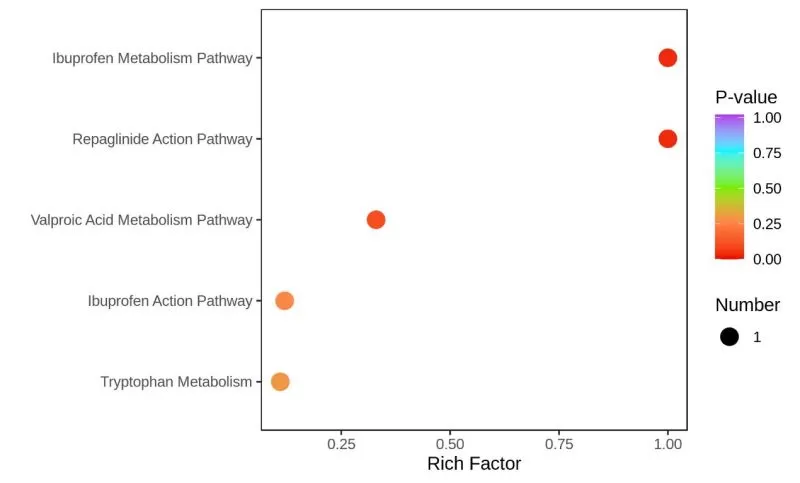 Similarly, after metabolite annotation is completed, HMDB enrichment analysis is carried out next based on differential metabolite results.
Similar to the results of KEGG enrichment analysis, the horizontal coordinate indicates the rich factor corresponding to each pathway, the vertical coordinate shows the pathway name (sorted by P-value), and the dots are colored by P-value, with redder indicating a more significant enrichment. The size of the dot represents the number of differential metabolites enriched. Therefore, it is important to combine the above three factors to select the pathways of greater interest and the differential metabolites that significantly affect these pathways for subsequent mechanism exploration.
3. MSEA enrichment analysis
A conventional enrichment analysis based on hypergeometric distribution relies on metabolites that are significantly up-regulated or down-regulated. It tends to miss some metabolites that are not significantly differentially expressed but are biologically important. The metabolite set enrichment analysis (MSEA) does not require specifying an explicit threshold for differential metabolites. The idea of this analysis is to set up a series of metabolic sets, each representing a certain biological function. The metabolome data is enriched to these metabolic sets, and the metabolic sets with significant differences are identified by statistics.
The metabolite databases are obtained from MebaboAnalyst (https://www.metaboanalyst.ca/), and the metabolic datasets include (1) 84 human metabolic pathways identified based on the KEGG database: 84 KEGG pathway metabolic sets (kegg_pathway); (2) biologically significant metabolic sets for specific biofluids associated with diseases: 339 blood metabolic sets, 384 urine metabolic sets, and 150 cerebrospinal fluid (CSF) metabolic sets.
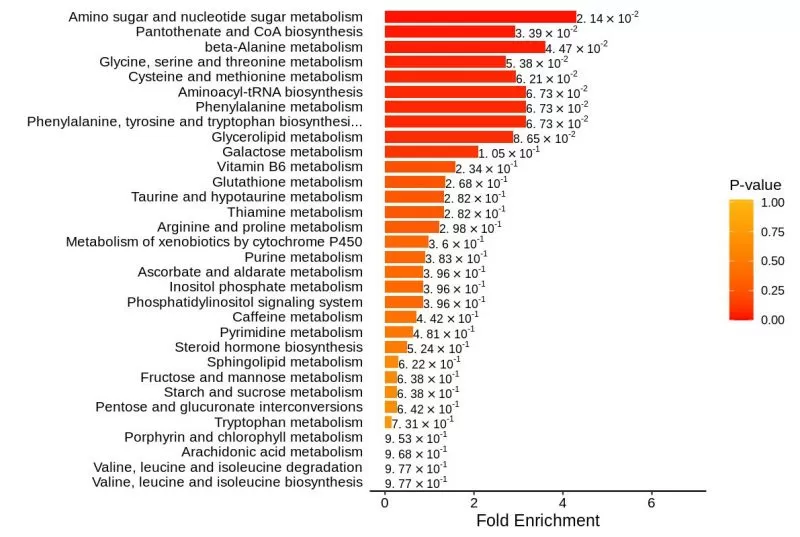
The metabolic sets with the highest P-values are selected for MSEA enrichment analysis and graphical presentation, in which the vertical coordinate indicates the name of the metabolic set (sorted by P-value), which corresponds to the P-value of the metabolic set; the horizontal coordinate indicates the fold enrichment; and the color indicates the P-value - the closer the P-value is to 0, the more reddish the color is, the more significant the enrichment is.
Next-Generation Omics Solutions:
Proteomics & Metabolomics
Ready to get started? Submit your inquiry or contact us at support-global@metwarebio.com.


