MaxQuant Software: Comprehensive Guide for Mass Spectrometry Data Analysis
Introduction to MaxQuant: Features and Capabilities
MaxQuant is a software package designed for the analysis of large mass spectrometry datasets, developed by the Max Planck Institute of Biochemistry. It is specifically tailored for high-resolution mass spectrometry (MS) data analysis and supports various labeling techniques (TMT/iTRAQ) as well as label-free quantification methods (LFQ/DIA). Its features include nonlinear mass calibration and the Match Between Runs function, which enhance protein identification and improve quantification accuracy. The installation package includes its search engine, Andromeda, along with a viewer application for inspecting raw data and qualitative and quantitative results. The official MaxQuant website provides additional software, Perseus, for statistical analysis of MaxQuant output.
MaxQuant Operations: Step-by-Step Guide
1) Downloading and Installing MaxQuant
2) Accessing and Navigating the MaxQuant Interface
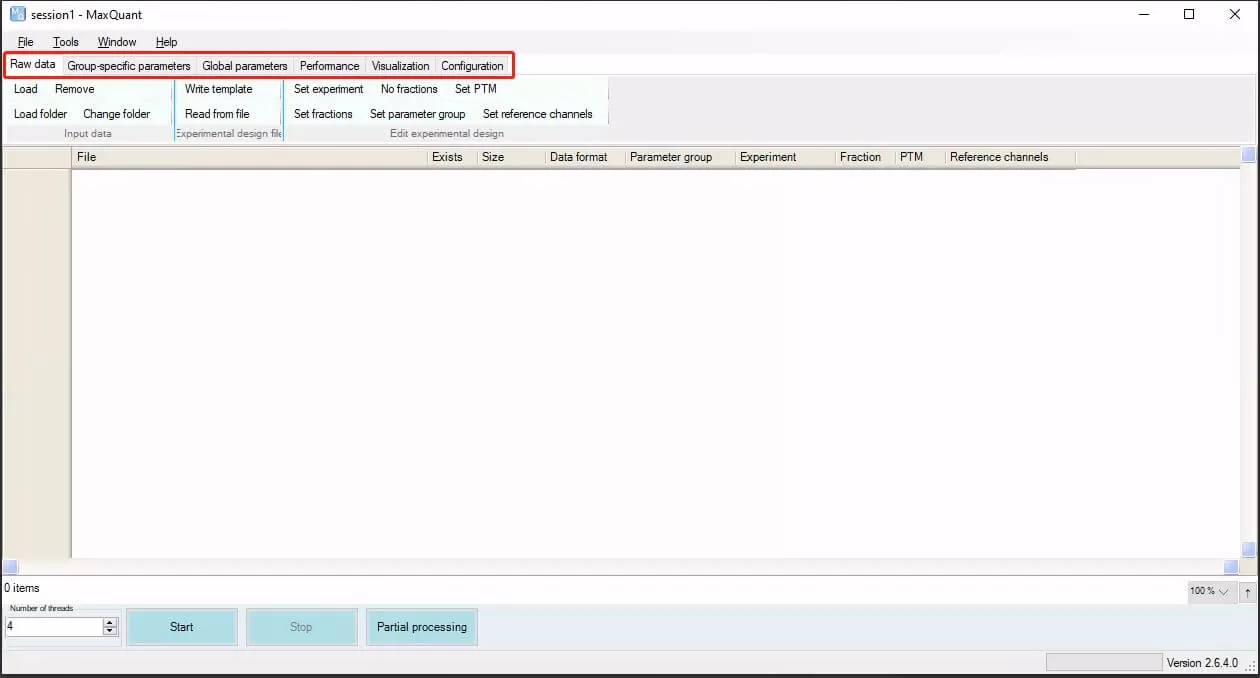
Navigate to the folder C:appMaxQuantv2.6.4.0bin and double-click MaxQuantGui.exe to access the MaxQuant interface. The red box highlights six main parameter configuration modules, most of which do not need to be altered and can remain at their default settings. Each module's commonly used parameter configurations will be introduced sequentially.
3) Configuring Raw Data and Experimental Conditions
Load LC-MS files from different instrument vendors, such as Thermo (.raw), ABSciex (.wiff), and Agilent/Bruker (.d), as well as universal formats like mzML and mzXML.
Load: Import selected mass spectrometry data.
Load folder: Import all mass spectrometry data from a selected folder.
Remove: Delete loaded mass spectrometry data.
Experimental Conditions Setup:
i) Set*: Select the row to configure settings. Use Set experiment to designate sample names, merging identical samples; Set fraction for components in experiments with fractions; Set PTM for post-translational modification experiments; Set reference channels for experiments with reference samples; and Set parameter group for different parameter groups, such as Label-free and SILAC designated as Group0 and Group1, respectively.
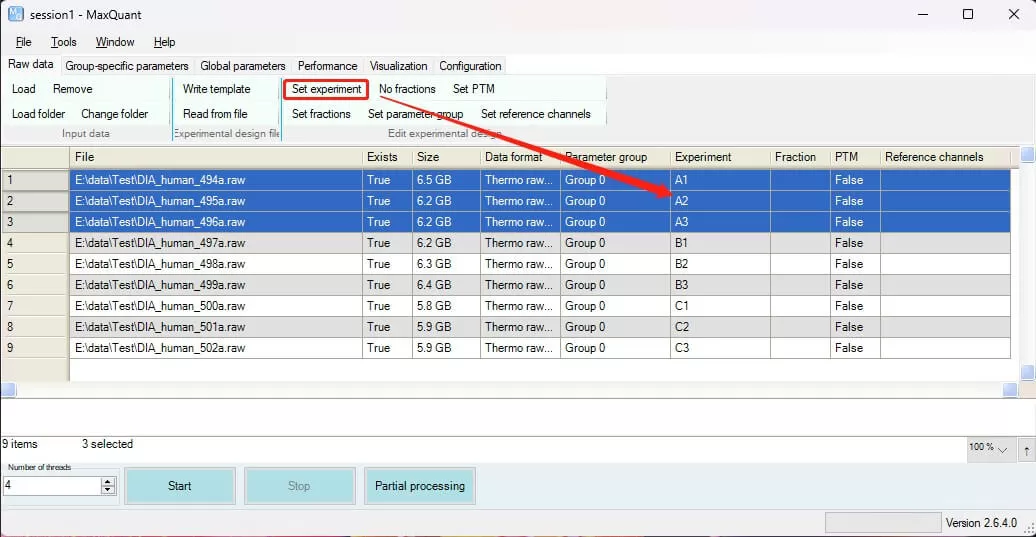
ii) Write template: Save the experimental condition setup for easy reuse in future database searches.
iii) Read from file: Load existing experimental settings.
4) Setting Group-Specific Parameters in MaxQuant
Type Settings:
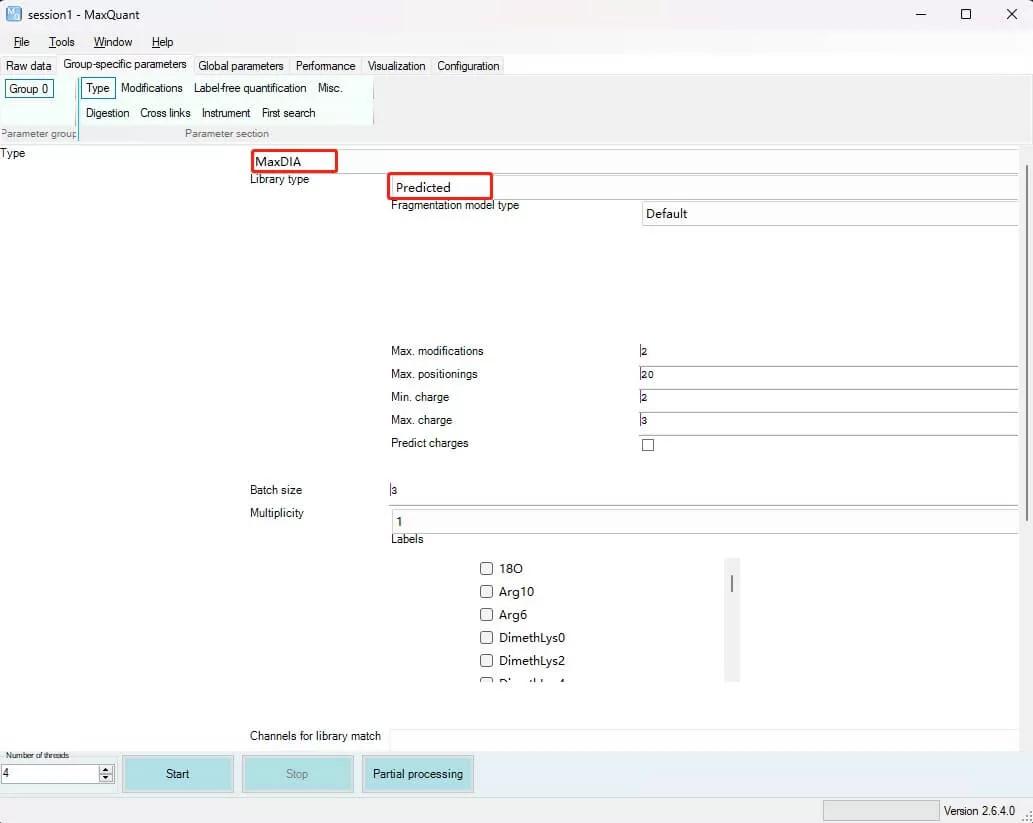
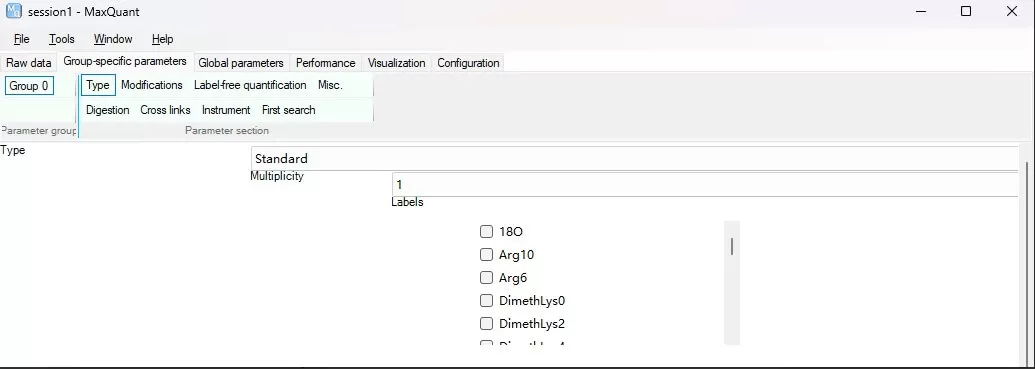
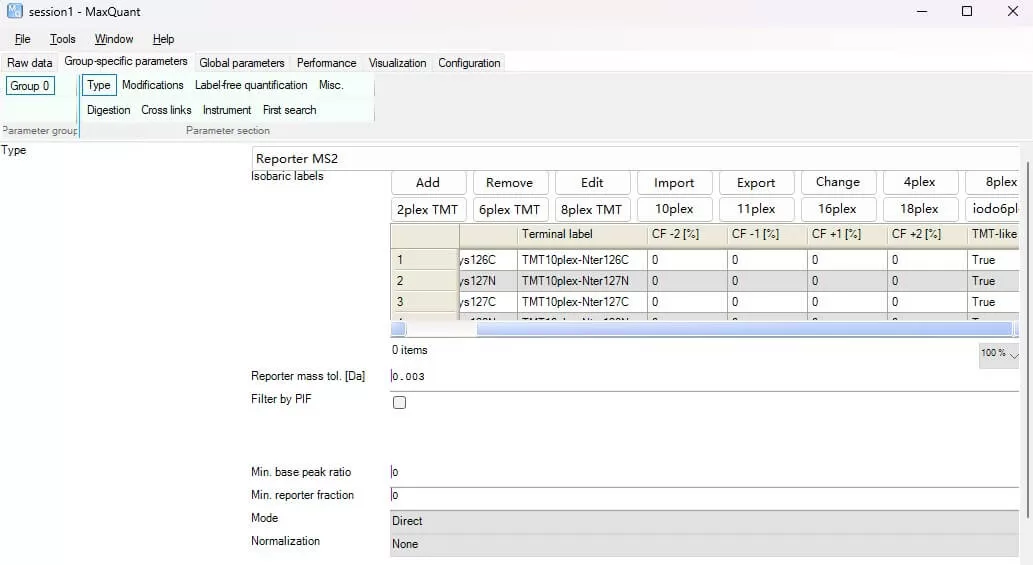
i) Type: Specify the type of LC-MS data. For Label-free (DDA) and SILAC experiments, select Standard; for iTRAQ/TMT experiments, select Reporter MS2; for 4D-DIA experiments (LC-MS runs from Bruker diaPASEF), select TIMS-MaxDIA; for other DIA experiments, select MaxDIA. Test data was obtained using the Thermo Scientific™ Orbitrap™ Astral™ mass spectrometer in DIA mode.
ii) Library type: Specify the type of spectral library for DIA experiments. For direct-DIA experiments, choose Predicted; for existing spectral files, prepare them in .tsv format and select tsv to import; alternatively, MaxQuant search results can be used as a spectral library by selecting MaxQuant import.
iii) Multiplicity: Specify the number of MS1 labels, applicable to Label-free and SILAC experiments. If unlabelled, set to 1; otherwise, select the appropriate label from the dropdown.
iv) Isobaric labels: Specify the type of MS2/MS3 labels for iTRAQ/TMT experiments. Choose according to the labeling reagents used (note: retain only the used labeling channels).
v) For different experiments, the settings in this section are shown below:
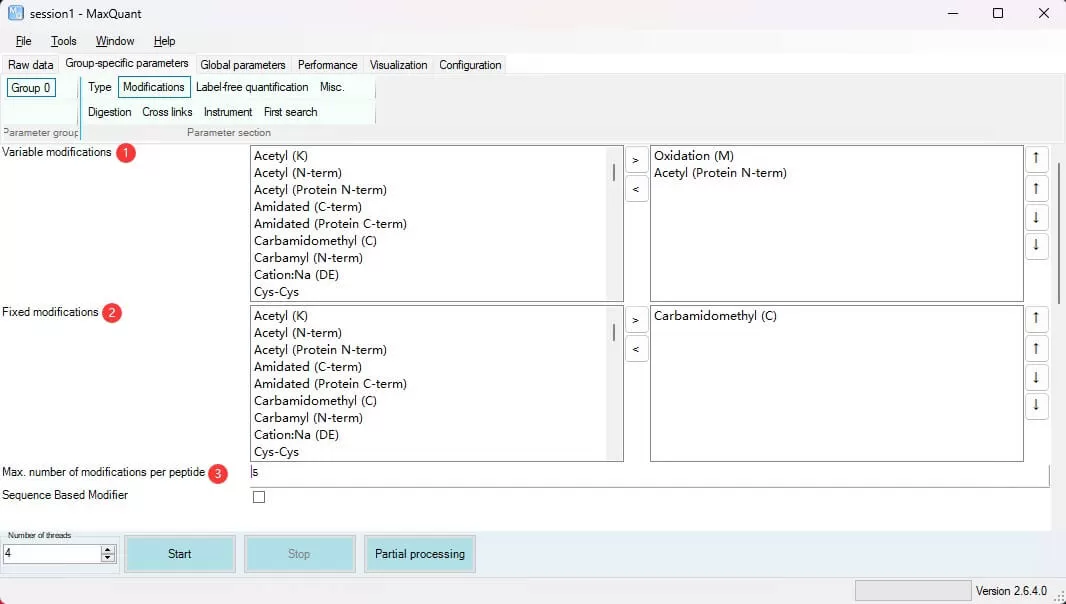
5) Modifications, Digestion, and Label-Free Quantification
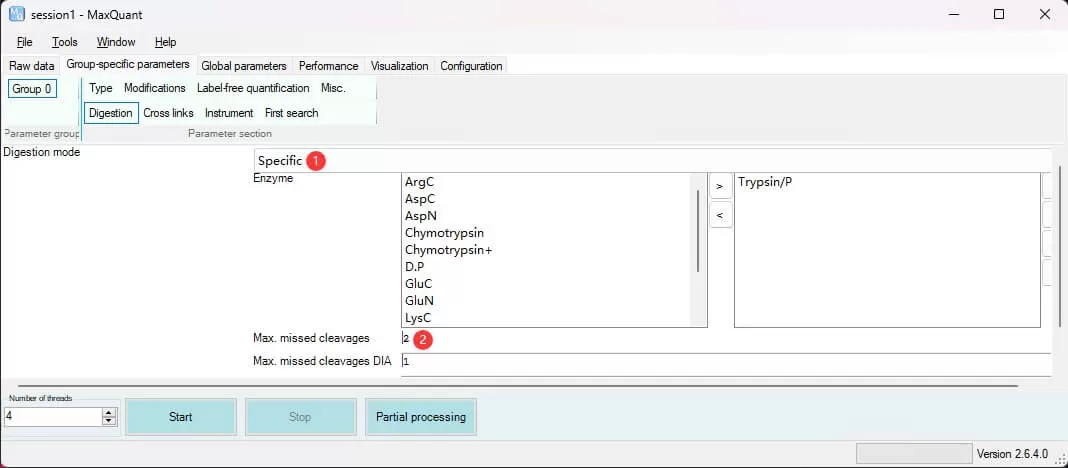
Digestion: Specify the proteolytic enzymes and their specific cleavage sites used in the experiment. Use the Digestion mode to set enzyme specificity; for specific cleavage, select Specific. Proteolytic digestion is not always complete, so set Max.missed cleavage to 2 to allow a maximum of two missed cleavages.
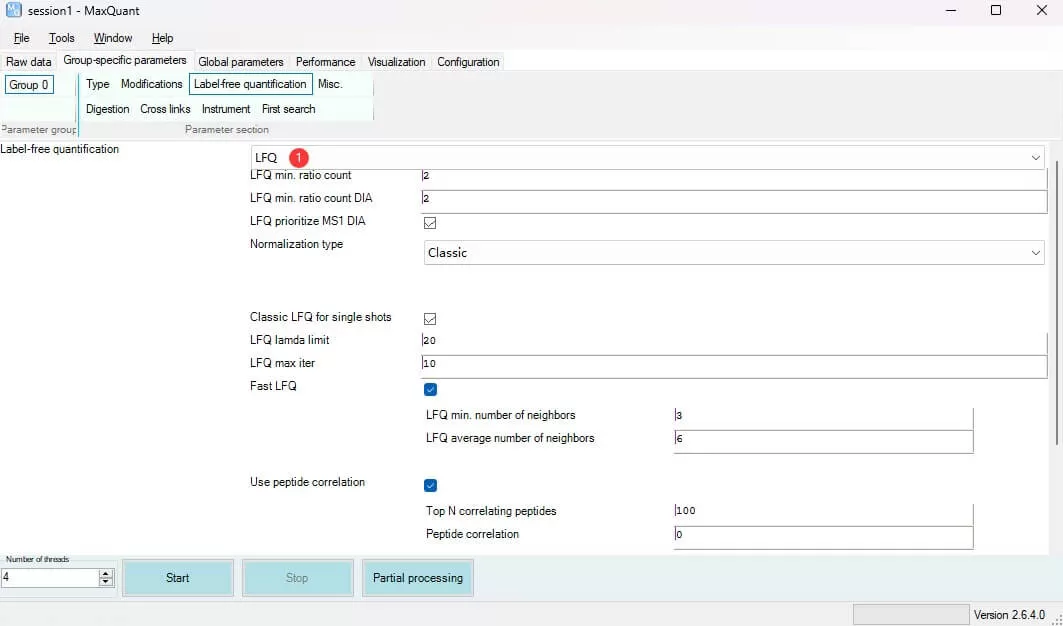
Label-free quantification: Determine whether to apply the MaxLFQ algorithm for inter-sample quantification analysis. For Label-free experiments (including DIA), LFQ is recommended; retain other parameters at their defaults.
Instrument: Generally, the software automatically recognizes the model of the mass spectrometer based on the LC-MS files.

6) Global Parameters Configuration for MaxQuant
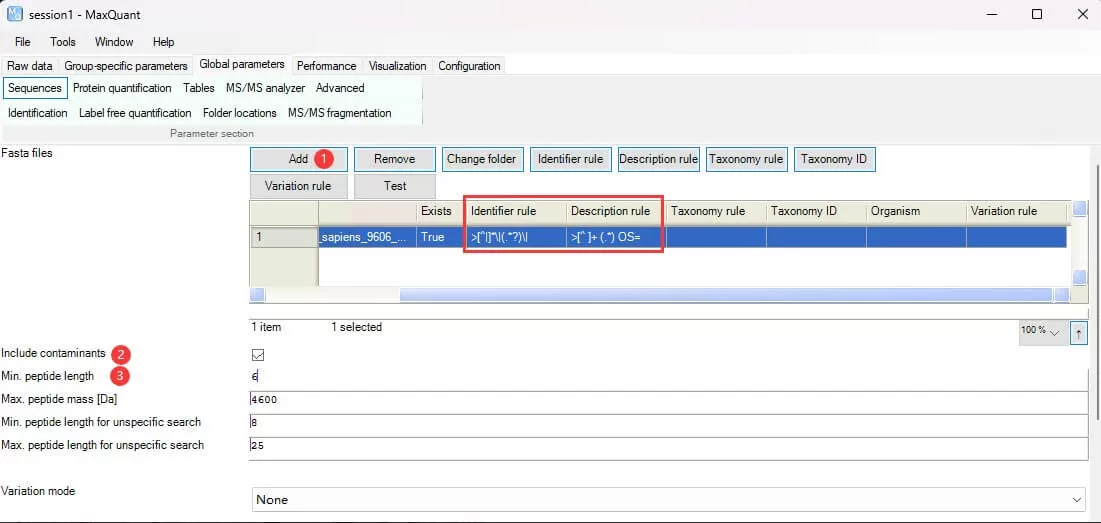
i) Sequences: Add databases and set identification filtering criteria related to sequences, with most parameters remaining at their defaults.
Fasta files: Add one or more database files using Add and set how to extract protein IDs and descriptions using Identifier rule or Description rule.
Include contaminants: Check to add common contaminant databases.
Min. peptide length: Set to 6 or 7 for the minimum peptide length for protein identification and quantification.
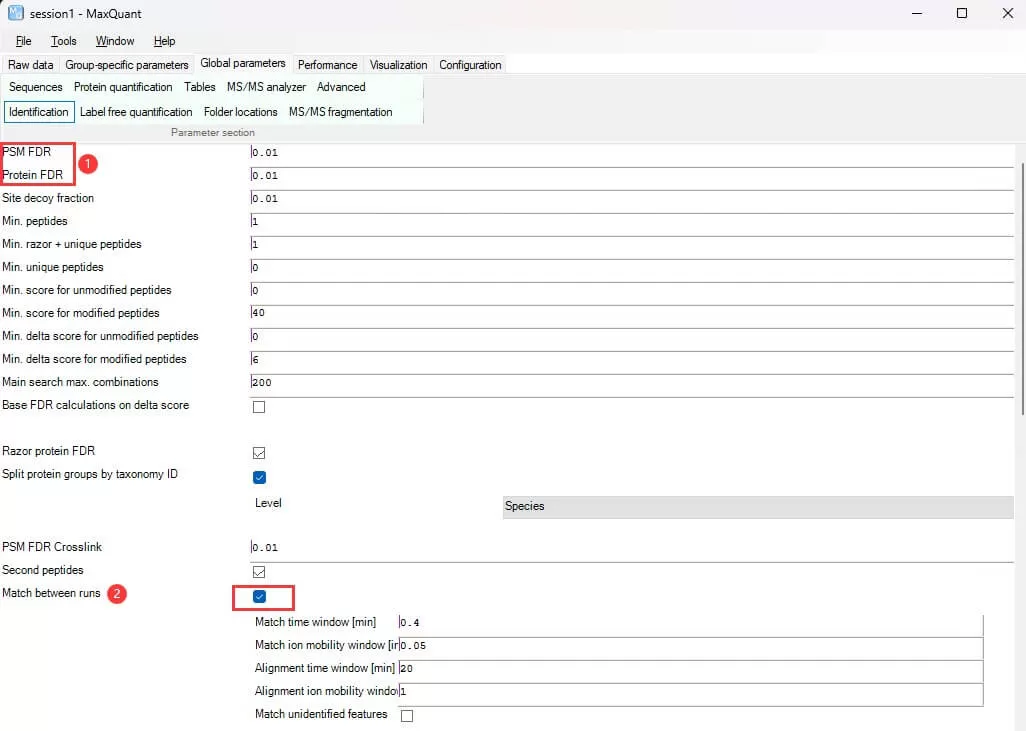
ii) Identification: Set peptide-spectrum match (PSM) and protein identification filtering criteria.
PSM/Protein FDR: Set the false discovery rate for PSM and protein levels, defaulting to 0.01.
Match between runs: Specify whether to use inter-sample MS2 matching to reduce missing values, defaulting to check.
Label free quantification: Configure settings for label-free quantification methods. If comparing expression levels of different proteins (iBAQ values calculated as protein intensity divided by the number of peptides matched to that protein), check iBAQ; retain other parameters at defaults.
7) Performance Settings: Maximizing Efficiency in Database Searches
Number of threads: Set the number of threads for operation based on the computer’s available threads. Once all parameters are configured, click Start to begin the database search. The Performance module displays the ongoing steps and status dynamically, with no additional settings required.
8) Overview of MaxQuant Result Files
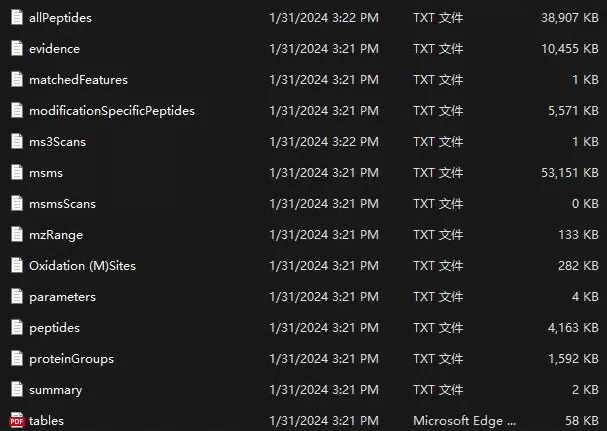
Upon completion of the search, the main result path is output/combined/txt, containing files such as the protein results table proteinGroups.txt and the peptide results table peptides.txt. For clarification on the header information in the results, refer to the tables.pdf file, which explains the meaning of each header in the txt result files.
9) Additional Visualization and Configuration Tools in MaxQuant
Visualization: A data visualization module for viewing MS1 and MS2 data, chromatograms, heatmaps, etc.
Configuration: The Andromeda configuration for setting modifications, enzymes, and database ID rules, typically does not require additional configuration.
Next-Generation Omics Solutions:
Proteomics & Metabolomics
Ready to get started? Submit your inquiry or contact us at support-global@metwarebio.com.


