Guide to Multi-Omics Association Analysis in Metabolomics and Transcriptomics
Multi-omics research integrates two or more omics technologies, such as genomics, transcriptomics, and proteomics, to enable comprehensive studies. The primary goal is to discover combinatorial biomarkers through correlation analysis and in-depth examination of multi-omics datasets. By utilizing this approach, researchers gain a holistic view of biological systems, uncovering complex interactions across molecular layers. This integration aids in identifying potential therapeutic targets, deepening our understanding of disease mechanisms, and advancing personalized medicine and more effective treatment strategies.
Multi-omics research is primarily composed of two key components: 1) correlation analysis using statistical methods (such as in studies examining microbial diversity and metabolomics), and 2) correlation analysis based on metabolic pathway exploration (as seen in studies combining transcriptomics and metabolomics). The first approach employs statistical techniques to uncover relationships between biological variables. For example, in microbial diversity studies, researchers can explore how shifts in microbial communities correlate with distinct metabolic profiles. The second approach highlights the role of metabolic pathways in explaining the link between gene expression and metabolite production. By integrating transcriptomic or proteomic data with metabolomic information, researchers can identify critical regulatory pathways that connect gene expression with metabolic outcomes.
In our previous blog, we provided a detailed step-by-step guide on conducting association analysis between the metabolome and microbiome. In this blog, we’ll shift our focus to demonstrating how to perform association analysis between the metabolome and transcriptome, offering clear insights into integrating these two powerful omics approaches.
Pathway Correlation Diagram
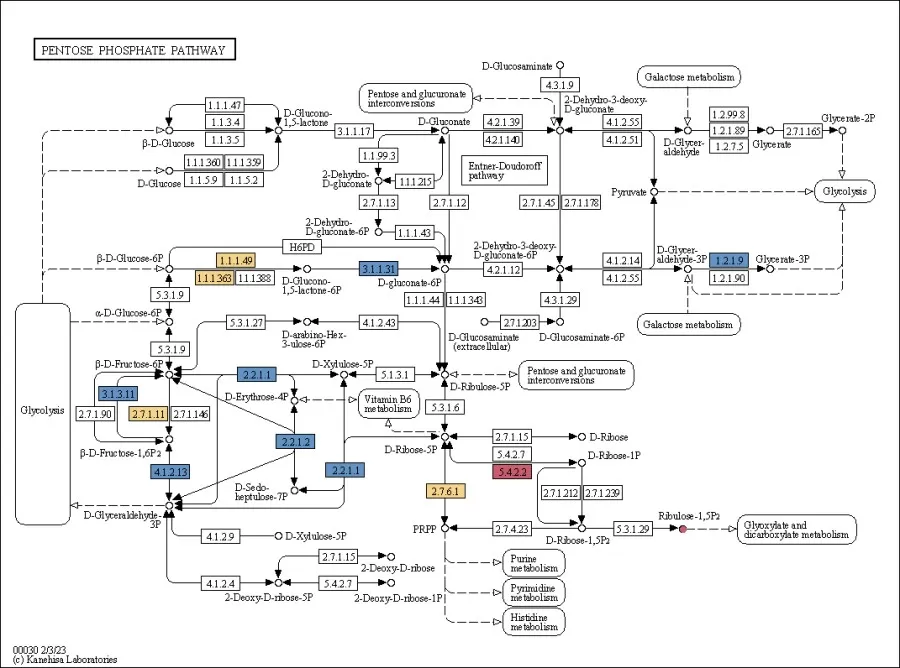
Based on metabolic pathways from the KEGG database, pathway correlation diagrams are created to analyze the relationships between genes (or proteins) and metabolites involved in the same metabolic pathway.
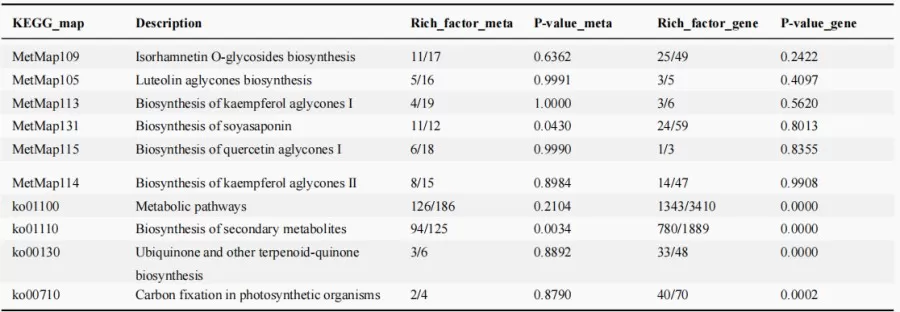
Metabolic Pathway Association Analysis Table
By integrating metabolites and genes commonly annotated in KEGG or MetMap pathways into one map, different colors are used to represent upregulated, downregulated, or unchanged metabolites. In the diagram, circles represent metabolites, while squares represent genes or proteins. Red indicates upregulation of a gene/protein or metabolite, blue indicates downregulation, and yellow signifies the presence of both upregulated and downregulated states for a gene or metabolite.
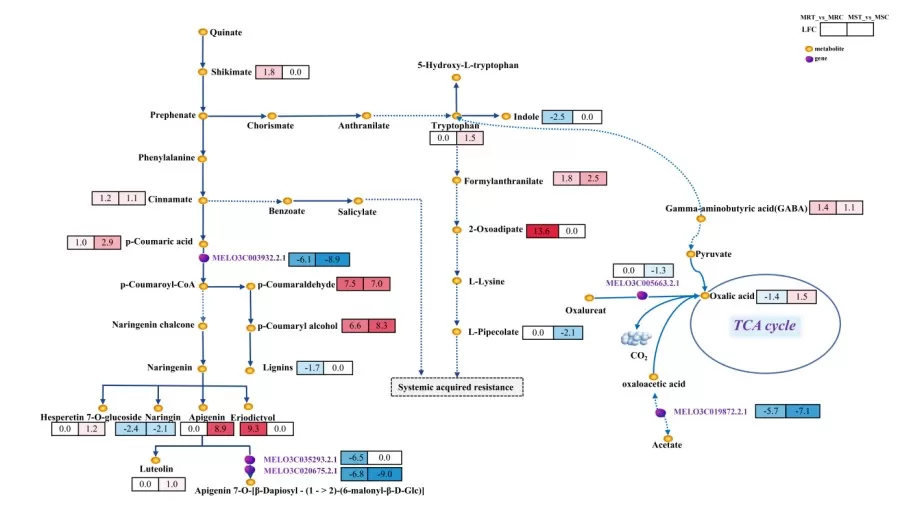
A similar analysis across multiple pathways can be used to generate a final regulatory pathway diagram.
Pathway Joint Enrichment Plot
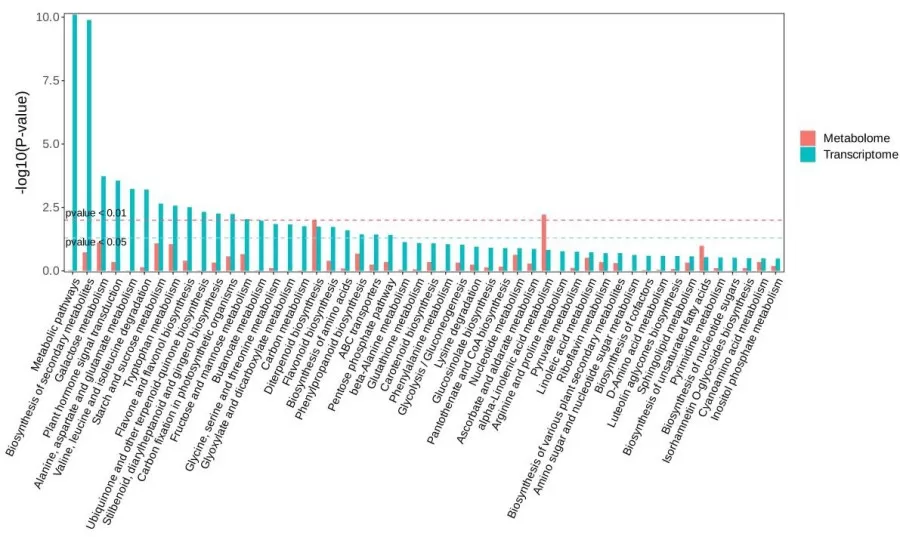
A bar chart can be created using pathways jointly enriched in both omics datasets (e.g., KEGG or MetMap pathways). The bar chart displays the p-value of enrichment for each pathway, with the x-axis representing the pathway names and the y-axis representing the p-value of the enrichment significance test. Red bars indicate data from the metabolomics analysis, while green bars represent data from the transcriptomics analysis.
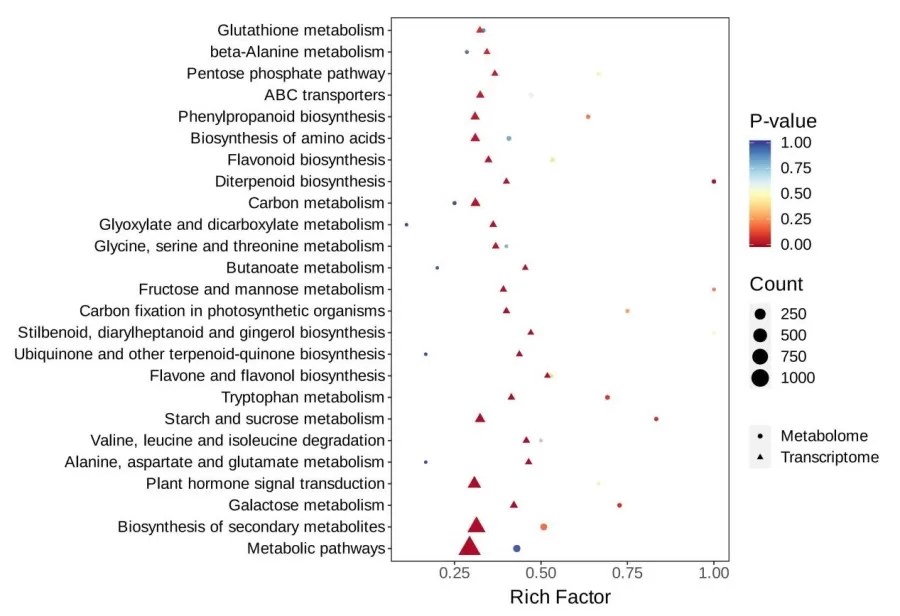
A bubble chart can be created to visualize pathways jointly enriched in both omics datasets, presenting a five-dimensional plot. The chart conveys enrichment information through various attributes: x and y coordinates, bubble color gradient, shape, and size. The x-axis represents the enrichment factor (Diff/Background) in different omics, while the y-axis shows the pathway names. The color gradient from red to yellow to blue reflects the significance of enrichment, with red indicating high significance and blue indicating low significance, as measured by the p-value. The bubble shape corresponds to different omics datasets, and the bubble size indicates the number of differential metabolites or genes, with larger bubbles representing a higher count.
KGML interaction network diagram
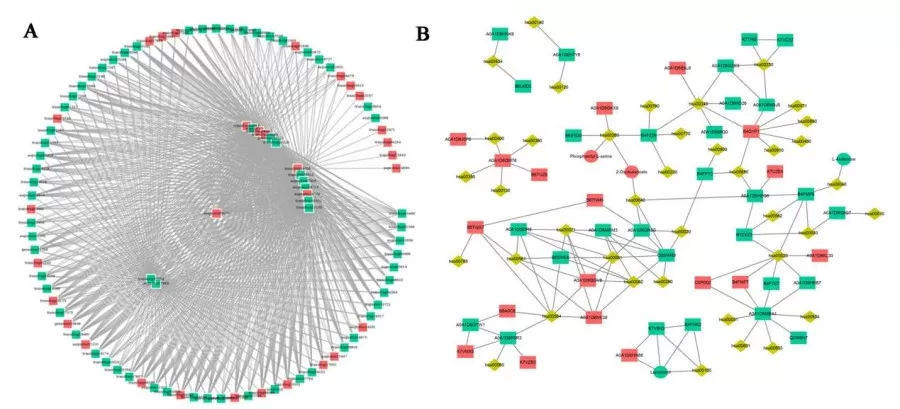
The KGML interaction network diagram utilizes KGML files from the KEGG database, which encompass both the relationships of graphical objects within KEGG pathways and information about orthologous genes from the KEGG GENES database. This data enables the establishment of network relationships between genes, gene products, and metabolites, facilitating a more systematic investigation of the interactions between transcriptomics and metabolomics.
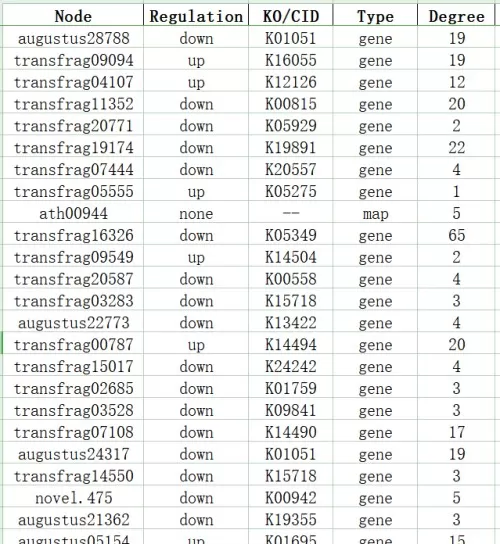
KGML Network Node Attributes Table
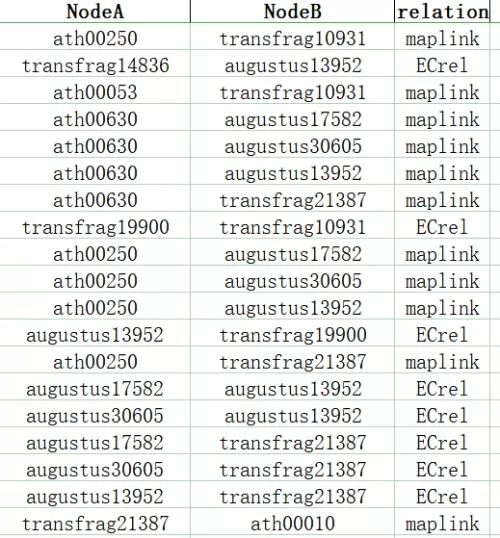
KGML Network Edge Relationship Table
In the diagram, squares represent genes or gene products, circles denote metabolites, and diamonds indicate pathway names. Red signifies upregulated genes, gene products, or metabolites, while green indicates downregulated genes, gene products, or metabolites.
All analyses mentioned in this article can be performed on the Metware Cloud Platform. For detailed instructions, please refer to our blog, "Step-by-Step Guide to Multi-Omics Association Analysis in Metabolomics and Microbiomics," which provides comprehensive guidance for researchers to effectively utilize the platform's capabilities in multi-omics association analysis.
Next-Generation Omics Solutions:
Proteomics & Metabolomics
Ready to get started? Submit your inquiry or contact us at support-global@metwarebio.com.


