GSEA Enrichment Analysis: A Quick Guide to Understanding and Applying Gene Set Enrichment Analysis
1. What is GESA enrichment analysis?
GSEA, which stands for Gene Set Enrichment Analysis, is a knowledge-based enrichment analysis method for gene sets. This method was published in the 2005 paper "Gene set enrichment analysis: a knowledge-based approach for interpreting genome-wide expression profiles."
2. Why Choose GSEA Over Traditional Enrichment Methods?
When it comes to gene enrichment analysis, we first think of hypergeometric analysis. So, what is GSEA enrichment analysis, and what are its advantages compared to the hypergeometric distribution? There are two issues with enrichment analysis based on the hypergeometric distribution:
- The hypergeometric distribution relies on significantly upregulated or downregulated genes, which can easily miss some genes that are not significantly differentially expressed but have important biological significance. Gene set enrichment analysis (GSEA) does not require specifying a clear threshold for differential genes. It sorts genes based on their degree of differential expression between two groups of samples and then uses statistical methods to test whether a pre-set gene set is enriched at the top or bottom of the sorted list.
- In conventional hypergeometric enrichment analysis, when enriching to a certain pathway, there is a situation where this pathway has both upregulated and downregulated differential genes. It is unclear whether this pathway is generally inhibited or activated. GSEA is a gene set enrichment analysis method that, when analyzing gene expression data, selects one or more functional gene sets for analysis (for example, a KEGG pathway can be considered as a gene set). The gene expression data is sorted based on its correlation with phenotypes or different samples, and then it is determined whether the genes within each gene set are located at the top or bottom of the gene list sorted based on the correlation with phenotypes to judge the impact of the coordinated changes of genes within the gene set on phenotypes or different treatment samples.
3. Step-by-Step Guide to Interpreting GSEA Results
1. The Principle of GSEA Enrichment Calculation
GSEA mainly includes three steps: calculating the enrichment score; estimating the significance level of the enrichment score; and multiple hypothesis testing.
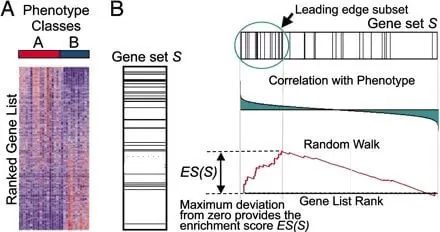
 GSEA takes as input the gene expression data of two groups of samples, identifies the differentially expressed genes between the two groups, and sorts them according to the Fold change to intuitively display the trend of changes in different genes across the two groups. After sorting, genes at the top are considered to be upregulated differential genes in Group A, and genes at the bottom are considered to be downregulated differential genes in Group A. Therefore, when performing GSEA analysis, if the genes in the selected gene set are enriched at the top of the list, it can be considered that this gene set has an upregulation trend, and if enriched at the bottom, it has a downregulation trend (see Figures A, B).
4. Visualizing and Understanding GSEA Graphical Outputs
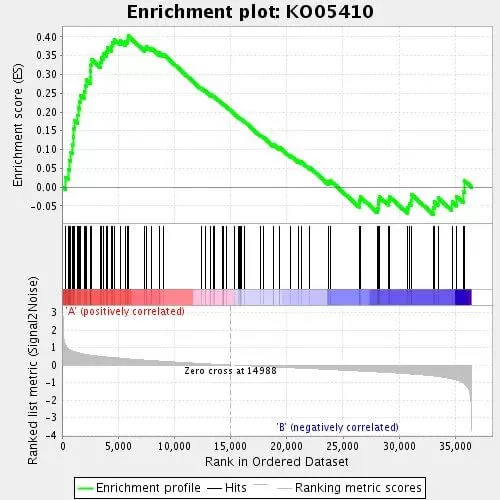
 The following figure is the standard graph for GSEA analysis, which is divided into three parts. The top part is the line chart of the gene Enrichment Score (ES), where each gene is calculated an ES value, and the line is formed by connecting these values. The horizontal axis represents each gene under the gene set, and the vertical axis represents the corresponding gene's Running ES. In the line chart, there is a peak, which is the Enrichment Score of this gene set. Generally, attention is paid to the Enrichment Score of the gene set, whether the peak appears at the front or the back (ES value greater than 0 at the front, less than 0 at the back), and the Leading-edge subset (i.e., the part that contributes the most to the enrichment, the leading subset). If the ES value is greater than 0, the genes before the peak are the Leading-edge subset; if the ES value is less than 0, the genes after the peak are the Leading-edge subset. The appearance of the leading subset in the ES chart indicates that this functional gene set has more significant biological significance under certain treatment conditions. If the peak appears at a positive value, it is believed that the genes before the peak are the core genes of the gene set. In the chart, we generally pay attention to the ES value, whether the peak appears at the front or the back (ES value greater than 0 at the front, less than 0 at the back), and the Leading-edge subset (i.e., the part that contributes the most to the enrichment); the appearance of the leading subset in the ES chart (before the red dashed line) indicates that this functional gene set has more significant biological significance under certain treatment conditions.
The middle part marks the position of each gene in the gene set with lines, where each vertical bar represents a gene, and the position of the vertical bar is the position of each gene in the gene set among all sorted genes. If the genes in the gene set are concentrated in the front part of all genes, they are enriched in Group A; if they are concentrated in the back part, they are enriched in Group B. The bottom part shows the change in all genes before and after treatment, which is generally the z-score value of the sorted Signal2Noise ratio. All figures are the same here. Red indicates high expression in Sample A, and blue indicates high expression in Sample B.
5. How to Access and Interpret GSEA Result Files
Viewing results: Click on the summary HTML result: index.html

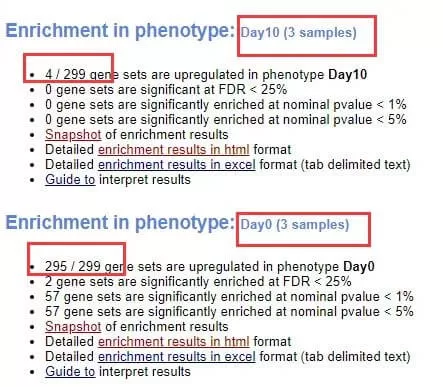
The samples from day 10 and day 0, with day 10 having 3 biological replicates and day 0 also having 3 biological replicates. 4/299 represents the number of enriched gene sets and the total number of gene sets analyzed.

The gene sets enriched under each group, generally speaking, show high expression within that group. By clicking on the "enrichment results" in the HTML, you can view the enrichment results on the web page.
_1723515695_WNo_1080d532.webp)
Here: GS stands for the name of the gene set; SIZE represents the total number of genes in that gene set; ES stands for Enrichment Score; NES stands for the normalized Enrichment Score; NOM p-val represents the p-value, indicating the credibility of the enrichment result; FDR q-val stands for q-value, which is the p-value adjusted after multiple hypothesis testing. (Note that GSEA uses p-value < 5%, q-value < 25% to filter the results.)
For a specific entry, clicking on Details will take you to the detailed results page for each gene set: "Upregulated in class" indicates that the gene set is highly expressed in the Long-term group.

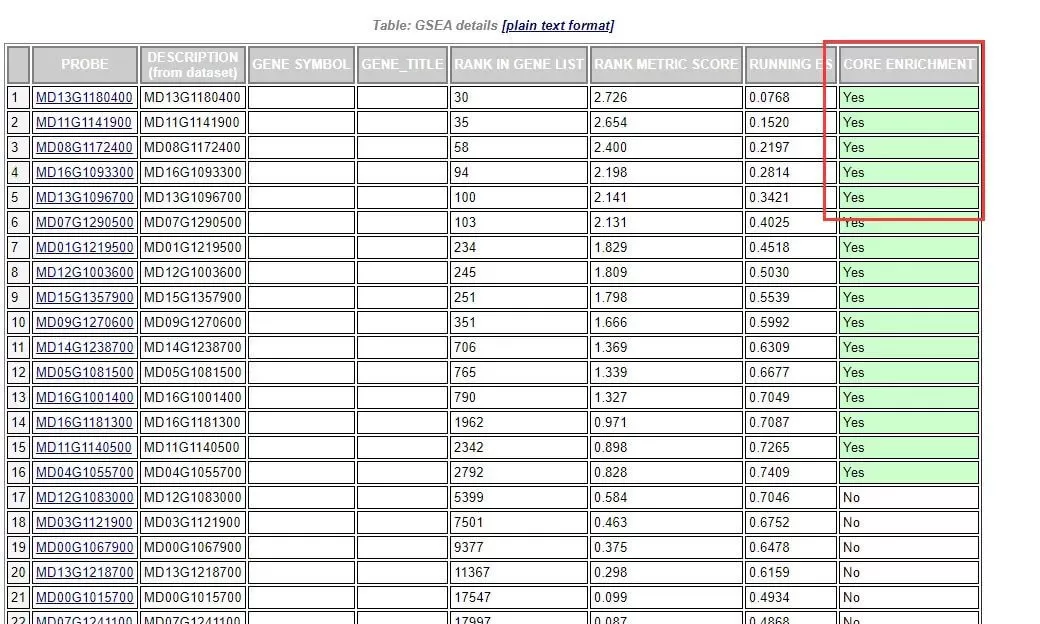
This provides detailed statistical information for each gene within the gene set. RANK IN GENE LIST represents the position of the gene in the ranked list; RANK METRIC SCORE represents the value of the gene's ranking metric, such as the fold change value; RUNNING ES represents the cumulative Enrichment Score; CORE ENRICHMENT indicates whether it belongs to the core genes, that is, genes that have made a major contribution to the Enrichment Score of the gene set. If it is "yes," it indicates that the gene has a significant contribution.
Read more:
· How to understand the WGCNA analysis in publications? (1/2)
· Understanding WGCNA Analysis in Publications
· Harnessing the Power of WGCNA Analysis in Multi-Omics Data
· WGCNA Explained: Everything You Need to Know
· Metabolomic Analyses: Comparison of PCA, PLS-DA and OPLS-DA
· A Comprehensive Guide to Correlation Network Graphs
· Comparative Analysis of Venn Diagrams and UpSetR in Omics Data Visualization
Next-Generation Omics Solutions:
Proteomics & Metabolomics
Ready to get started? Submit your inquiry or contact us at support-global@metwarebio.com.


