How to Perform Gene Ontology (GO) Enrichment Analysis
In transcriptomics and proteomics studies, researchers often generate extensive lists of differentially expressed genes or proteins. While identifying these candidates is a critical first step, understanding their functional roles and biological relevance remains paramount. Gene Ontology (GO) enrichment analysis bridges this gap by linking gene/protein lists to standardized functional annotations. This article introduces the fundamentals of GO enrichment analysis, its major categories, and a step-by-step workflow using the 'clusterProfiler' R package.
Introduction to GO Enrichment Analysis
Gene Ontology (GO) Enrichment Analysis is a powerful bioinformatics tool for deciphering the biological significance of gene sets. It identifies statistically overrepresented functional terms within a gene list by comparing it to reference annotations in the GO database. The analysis employs rigorous statistical methods (e.g., hypergeometric or Fisher’s exact tests) to calculate enrichment significance, enabling researchers to extract biologically meaningful insights from large-scale omics data. These insights are critical for unraveling molecular mechanisms, disease pathways, and therapeutic targets. The GO database categorizes gene functions into three domains:
1. Molecular Function (MF): Describes biochemical activities of gene products (e.g., enzymatic catalysis, ligand binding). Example: Enrichment in "ion channel activity" (GO:0005216) suggests involvement in ion transport regulation.
2. Cellular Component (CC): Indicates subcellular localization (e.g., cell membrane, nucleus, mitochondria). Example: Enrichment in "mitochondrial matrix" (GO:0005759) implies roles in mitochondrial metabolism.
3. Biological Process (BP): Represents broader biological events (e.g., cell cycle, apoptosis, signal transduction). Example: Enrichment in "inflammatory response" (GO:0006954) highlights genes regulating immune pathways.
GO Enrichment Analysis Using 'clusterProfiler'
'clusterProfiler' is a widely used R package for functional enrichment analysis, supporting GO, KEGG, and Reactome pathways. Below is a practical workflow for GO enrichment analysis.
1. Environment Setup
Install and load required R packages:
if (!requireNamespace("BiocManager", quietly = TRUE)) {
install.packages("BiocManager")
}
if (!requireNamespace("clusterProfiler", quietly = TRUE)) {
BiocManager::install("clusterProfiler")
}
if (!requireNamespace("org.Hs.eg.db", quietly = TRUE)) {
BiocManager::install("org.Hs.eg.db")
}
if (!requireNamespace("GO.db", quietly = TRUE)) {
BiocManager::install("GO.db")
2. Data Preparation
Assume a differentially expressed gene (DEG) list is generated from RNA-seq analysis. Load the data:
DiffDataFrame <- read.csv("B_vs_A.diff.xls", sep = "t")
head(DiffDataFrame)
## ID baseMean log2FoldChange pvalue padj regulated
## 1 ENSG00000001084 3155.3666 1.66483 0 0 up
## 2 ENSG00000023909 6448.8749 1.85860 0 0 up
## 3 ENSG00000100292 10027.3640 5.78664 0 0 up
## 4 ENSG00000117525 5109.3190 1.90061 0 0 up
## 5 ENSG00000132002 8206.3453 1.29174 0 0 up
## 6 ENSG00000140961 885.8424 3.50181 0 0 up
3. Perform GO Enrichment Analysis
Use the 'enrichGO' function:
library(clusterProfiler)
library(org.Hs.eg.db)
enrichFrame <- enrichGO(gene = DiffDataFrame$ID,
OrgDb = org.Hs.eg.db,
keyType = "ENSEMBL",
ont = "ALL",
pAdjustMethod = "BH",
pvalueCutoff = 0.05,
qvalueCutoff = 0.2)
Parameter Details:
- 'gene': Input gene IDs (ENSEMBL, Entrez, or SYMBOL).
- 'OrgDb': Organism-specific annotation database (e.g., `org.Mm.eg.db` for mouse).
- 'ont': Specify ontology category.
- 'pAdjustMethod': Multiple testing correction (e.g., "BH", "bonferroni").
- 'readable': Converts IDs to gene symbols for interpretability.
4. Result Interpretation and Visualization
Analysis results: the enrichFrame object contains many information, such as the ID, name, description of the pathway, the number of genes enriched, the proportion of the number of genes of the pathway in the background gene set, the p-value, the adjusted p-value, and so on. We can get the detailed enrichment analysis results by viewing the contents of enrichFrame.
head(enrichFrame[1:6,1:8])
## ONTOLOGY ID
## GO:0006986 BP GO:0006986
## GO:0035966 BP GO:0035966
## GO:0044344 BP GO:0044344
## GO:0071774 BP GO:0071774
## GO:0009408 BP GO:0009408
## GO:0034976 BP GO:0034976
## Description GeneRatio
## GO:0006986 response to unfolded protein 14/234
## GO:0035966 response to topologically incorrect protein 14/234
## GO:0044344 cellular response to fibroblast growth factor stimulus 12/234
## GO:0071774 response to fibroblast growth factor 12/234
## GO:0009408 response to heat 11/234
## GO:0034976 response to endoplasmic reticulum stress 16/234
## BgRatio RichFactor FoldEnrichment zScore
## GO:0006986 161/21468 0.08695652 7.977703 9.329148
## GO:0035966 178/21468 0.07865169 7.215788 8.741703
## GO:0044344 126/21468 0.09523810 8.737485 9.144190
## GO:0071774 134/21468 0.08955224 8.215844 8.795916
## GO:0009408 136/21468 0.08088235 7.420437 7.884896
## GO:0034976 316/21468 0.05063291 4.645245 6.852866
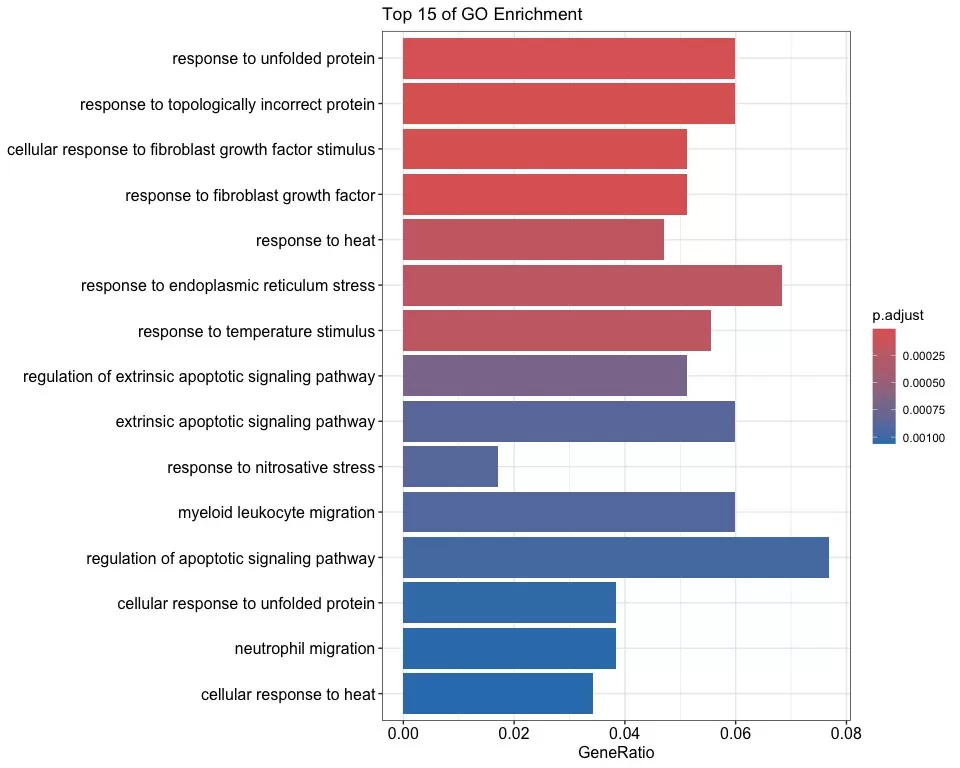
Visualization: clusterProfiler provides a variety of visualizations to present GO enrichment analysis results. For example, drawing bar charts and bubble charts:
# Drawing bar graphs
barplot(enrichFrame,
x = "GeneRatio",
color = "p.adjust",
title = "Top 15 of GO Enrichment",
showCategory = 15,
label_format = 80
)

GO Enrichment Bar Plot
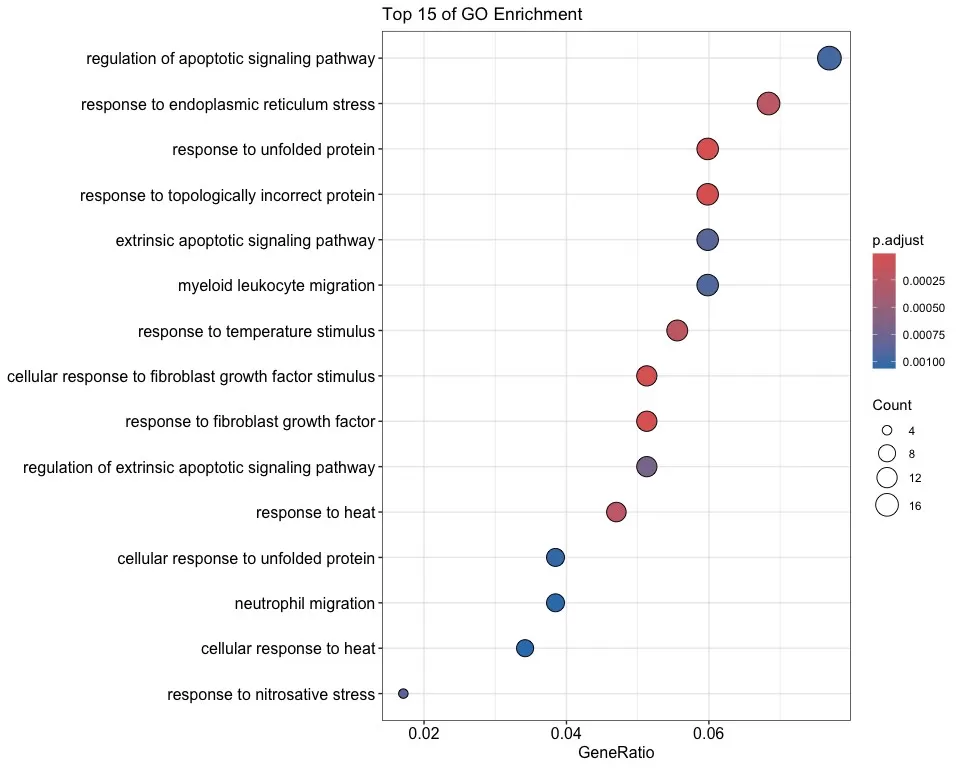
In addition to demonstrating the degree of enrichment, the bubble map also reflects the number of genes involved in that GO term by the bubble size, which indicates the significance level by the color, enabling us to understand the results of the GO enrichment analysis in a more comprehensive way.
dotplot(enrichFrame,
x = "GeneRatio",
color = "p.adjust",
title = "Top 15 of GO Enrichment",
showCategory = 15,
label_format = 80
)

GO enrichment bubble map
5. Biological Insights from GO Enrichment
Significantly enriched terms (e.g., p.adjust < 0.05) reveal key biological themes. For instance, enrichment in "regulation of apoptosis" (GO:0042981) suggests DEGs modulate cell death pathways. Cross-referencing with literature or pathway databases (e.g., KEGG, Reactome) strengthens mechanistic hypotheses.
Gene Ontology (GO) enrichment analysis is a fundamental approach in genomics research, enabling researchers to uncover the functional roles and biological significance of gene or protein sets. By utilizing powerful tools such as clusterProfiler, GO enrichment analysis can be performed efficiently, with results visualized through intuitive plots like bar charts, dot plots, and enrichment maps. In practice, researchers can tailor the analysis by selecting appropriate methods and parameters based on specific research questions, thereby extracting meaningful biological insights from gene enrichment patterns. This approach provides robust support for scientific investigations, helping to identify key pathways, mechanisms, and potential biomarkers relevant to the study.
Alternative Tools: Metware Cloud Platform
For researchers lacking programming expertise, Metware Cloud Platform offers a user-friendly interface for GO/KEGG enrichment, GSEA, and differential expression analysis. Key features include:
- No-Code Analysis: Upload data, select parameters, and generate reports via GUI.
- Advanced Visualization: Interactive heatmaps, network diagrams, and pathway maps.
- Multi-Omics Integration: Combine transcriptomic, proteomic, and metabolomic data.
Read more
- Multi-Omics Association Analysis Series
- Omics Data Processing Series
- Understanding WGCNA Analysis in Publications
- Deciphering PCA: Unveiling Multivariate Insights in Omics Data Analysis
- Metabolomic Analyses: Comparison of PCA, PLS-DA and OPLS-DA
- WGCNA Explained: Everything You Need to Know
- Harnessing the Power of WGCNA Analysis in Multi-Omics Data
- Beginner for KEGG Pathway Analysis: The Complete Guide
- GSEA Enrichment Analysis: A Quick Guide to Understanding and Applying Gene Set Enrichment Analysis
- Comparative Analysis of Venn Diagrams and UpSetR in Omics Data Visualization
Next-Generation Omics Solutions:
Proteomics & Metabolomics
Ready to get started? Submit your inquiry or contact us at support-global@metwarebio.com.


