Unveiling Biomarkers: Differential Metabolite Screening in Metabolomics Research
Metabolomics Biomarker Series Article Catalog:
1. Unlocking Biomarkers: A Guide to Vital Health Indicators
2. Metabolomics and Biomarkers: Unveiling the Secrets of Biological Signatures
3. Choosing the Right Study Design for Metabolomics Biomarker Discover
4. Metabolomics Biomarker Screening Process
5. Identifying the Right Samples: A Guide to Metabolomics Biomarker Research
6. Data Normalization in Metabolomics Biomarker Research
7. Data Cleaning in Metabolomics Biomarker Research
8. Data Analysis in Metabolomics Biomarker Research
Welcome back to our deep dive into metabolomics biomarker research. In our recent discussions, we explored the landscape of overall metabolite analysis, employing techniques such as Principal Component Analysis (PCA), Orthogonal Projections to Latent Structures Discriminant Analysis (OPLS-DA), and clustering analysis. These methods have provided us with a comprehensive understanding of the global patterns and relationships within our metabolomics data.
As we advance in our analytical journey, we shift our focus from these broad analyses to more targeted investigations. The next critical step is screening for differential metabolites—those specific compounds that exhibit significant changes under different conditions or between distinct groups. Differential metabolite screening is often the most basic and critical part of data analysis. There are many ways to analyze the metabolites, such as PLS-DA, OPLS-DA, T-test, and fold change. In this upcoming blog, we will delve into the methodologies and criteria for identifying differential metabolites. The principles, screening indexes, threshold settings, and combinations of the common statistical screening methods in metabolomics research are described in detail below. These insights are essential for pinpointing the biomarkers that hold the potential to unlock new understandings of health and disease.
1. Fold change method (FC value)
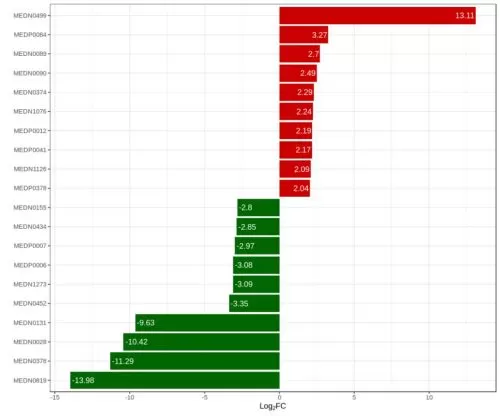 The fold change method calculates the fold change (FC value) in the expression of a metabolite between two groups according to the relative or absolute quantification of that metabolite. Assuming that substance A has a quantitative result of 1 in the control group and a quantitative result of 3 in the disease group, the FC value for this substance is 3. Since the quantification result of a metabolite must be non-negative, the FC value is (0, +∞). In order to screen the metabolites with more significant differences, the screening criteria can be set as FC ≥ 2 or ≤ 0.5, which is relatively strict. If only a few differential metabolites are screened, the FC threshold can be adjusted to 1.5 or 1.2 according to the needs. These two thresholds are also well established in publications concerning metabolomics research.
In addition, to present a better plotting effect, the log2 logarithm of the FC value is usually taken in the analysis. If log2FC ≥ 1, it means that this differential metabolite was up-regulated; if log2FC ≤ -1, it means that this differential metabolite was down-regulated.
2. T-test (P-value)
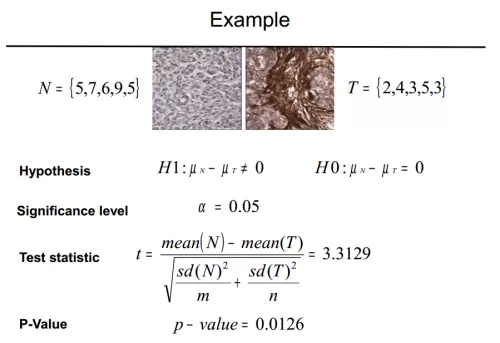 T-test, also known as student's t-test, is a commonly used hypothesis testing method and one of the frequent statistical strategies in differential metabolite screening. Hypothesis testing starts with a hypothesis. We first assume that there is no difference between the levels of a metabolite in groups A and B (H0, null hypothesis). Then, based on this assumption, the statistical t-value and its corresponding p-value are calculated by t-test. If the p-value < 0.05, it means that a small probability event is present, and we should reject the null hypothesis - i.e., the levels of that metabolite are significantly different in groups A and B.
Metabolomics data is characterized by high dimensionality, so when performing univariate analysis, we will face the problem of multiple hypothesis testing. If we do not apply an α correction to the test level of each hypothesis test, the overall probability of making a class 1 error increases significantly, yielding more false positives. This problem can be solved by using the Bonferroni correction, i.e., dividing the original test level by the number of hypothesis tests m as the new test level (α/m) for each hypothesis test. However, the Bonferroni correction is overly conservative with stringent screening criteria, which significantly reduces the effectiveness of the test. The false discovery rate (FDR) is a method for estimating the number of false positives that may be included in a positive result of a multiple-hypothesis test. The FDR method not only controls the proportion of false positives within a specified range but also significantly improves the efficacy of the test over conventional methods.
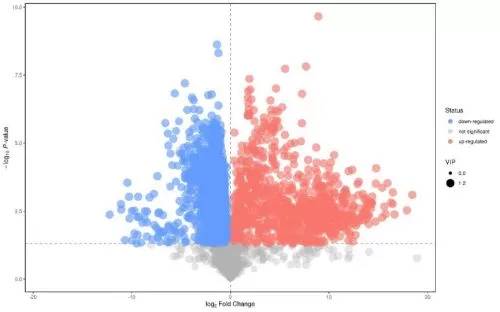 In summary, if the T-test is selected as the method for differential metabolite screening, the P-value or FDR-value needs to be selected as the test value, followed by setting the threshold value for it. The P-value is calculated from the negative binomial distribution, and the FDR-value is obtained from the P-value corrected by multiple testing. The threshold for the P-value or FDR value is usually set at 0.05, or the threshold can be lowered or raised appropriately (e.g., 0.01, 0.001, and so on) depending on the specific conditions of the results.
Important notice: T-tests require the premise that the data conforms to a normal distribution. Metabolomics data, after a series of data preprocessing, such as normalization, usually conforms to a normal distribution, thus allowing the use of this analysis method. However, there are also special cases where the data does not fit the normal distribution. Non-parametric tests, such as the Wilcoxon signed rank test and the Mann-Whitney U-test, are required at this point.
Comparison table of parametric and non-parametric test methods
|
Parametric test |
Non-Parametric test |
|
Paired t-test |
Wilcoxon Rank sum test |
|
Unpaired t-test |
Mann-Whitney U-test |
|
Person correlation |
Spearmen correlation |
|
One-way ANOVA |
Kruskal wallis Test |
3. (O)PLS-DA method (VIP value)
As metabolomics data are characterized by "high dimensionality, high noise, and high variability", multivariate statistical analysis is generally used to "simplify and downsize" the high-dimensional and complex data while retaining the original information to the greatest extent possible, and to establish a reliable mathematical model to summarize the metabolic profiles of the research subjects. Common multivariate statistical analysis methods include PLS-DA and OPLS-DA.
 The partial least squares discriminant analysis (PLS-DA) is a multivariate statistical analysis method with supervised pattern recognition, in which multi-dimensional data are grouped by the differential factor to be searched before being compressed (with a pre-set Y-value for target classification and discrimination). In this way, we can find the variables that are most correlated with the factor used for grouping and reduce the influence of some other factors. PLS-DA is commonly used to distinguish overall differences in metabolic profiles between groups and to screen for differential metabolites between groups.
The orthogonal partial least squares discriminant analysis (OPLS-DA) combines the orthogonal signal correction (OSC) and PLS-DA methods and is able to decompose the X matrix information into two categories of information, i.e., Y-related and Y-unrelated information. It screens for differential variables by removing the irrelevant variances.
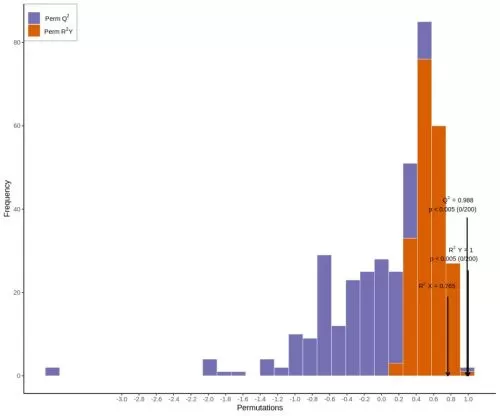
The specific process is as follows: Logarithmic transformation plus UV formatting of the data is carried out using the SIMCA software - first, the first principal component is subjected to OPLS-DA modeling analysis, with the quality of the model examined by 7-fold cross-validation; second, model validity is assessed by using R2Y (the extent to which the model explains categorical variable Y) and Q2 (the predictability of the model) obtained after cross-validation; finally, the model validity is further tested by permutation test, in which different random Q2 values are obtained by randomly changing the order of categorical variables Y for 200 times.
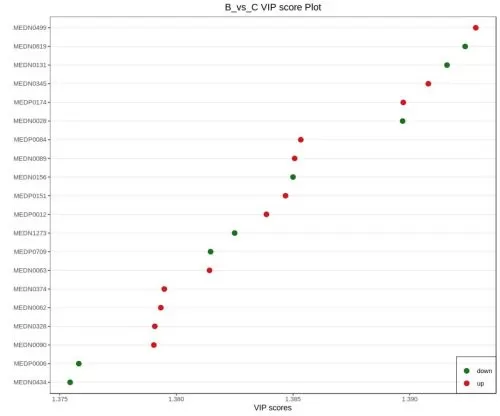
The VIP (variable important in projection) is the variable weight value of (O)PLSDA model variables, which can be used to measure the strength and explanatory power of the effect of accumulated differences in each metabolite on the categorical discrimination of each group of samples. VIP ≥ 1 is a frequently used criterion for differential metabolite screening.
4. Use of screening indicators
Among the above three analysis methods, the fold change method and the T-test method are univariate analysis methods, and (O)PLS-DA analysis is a multivariate method. Since metabolomics data are characterized as “high-dimensional and massive”, it is recommended to use a combination of uni-dimensional and multi-dimensional methods and to analyze the data from different perspectives according to their characteristics. Taking into account the results of both types of statistical analyses helps us to look at the data and draw conclusions from different perspectives, and also helps us to avoid false positives or model overfitting brought about by using only one type of statistical analysis.
In order to screen for metabolites with more significant differences, it is recommended that the screening method be a combination of FC-value, P-value, and VIP-value; if few differential metabolites are screened, P-value and VIP-value or FC-value and VIP-value combinations can also be selected. In addition, however, if the model constructed using the (O)PLS-DA method does not work well, it is also feasible to choose a combination of P-value and FC-value as the criteria for differential metabolite screening in this case.
5. Multiple linear regression method
Fold change, T-test, and (O)PLSDA are the three most common differential metabolite screening methods, but in addition, multiple linear regression analysis can also be used for differential metabolite screening.
Regression analysis is a statistical analysis method that examines the linear relationship between a variable and another variable or some other variables. The simplest case in regression analysis is the one where the model contains only one dependent variable and one independent variable. If the variations between the two variables follow a rectilinear trend, and a linear equation is selected to describe the change pattern, it is called simple linear regression. When a dependent variable and multiple independent variables are involved in the regression analysis, it is called multiple linear regression. Multiple linear regression is more in line with what we have, as in metabolomics studies, changes in the content of a metabolite are indeed driven by a combination of many factors.
For example, suppose a project is studying metabolic changes in young, middle-aged, and elderly patients after treatment with different doses of a drug. This study would fit a binary linear regression model with the following regression equation: 
Where y denotes the metabolite content, x1 denotes the dose factor, x2 denotes the age factor, b0 is the intercept, b1 and b2 are the regression coefficients, and u denotes the error. A t-test (test of significance) will be performed on the regression coefficients individually. If the P-value is less than 0.05, it means that the metabolite is significantly different in the group of that dependent variable.
|
|
Low dose |
Medium dose |
High dose |
|
Young |
a |
b |
c |
|
Middle-aged |
d |
e |
f |
|
Elderly |
g |
h |
i |
Next-Generation Omics Solutions:
Proteomics & Metabolomics
Ready to get started? Submit your inquiry or contact us at support-global@metwarebio.com.


