Correlation Analysis and Correlation Networks: Key Techniques for Exploring Data Relationships
Vast amounts of data are being accumulated across diverse business and scientific fields. Extracting useful insights and understanding intrinsic relationships within these datasets has become a critical challenge in data analysis. Correlation analysis and correlation networks have emerged as powerful tools to address this challenge, enabling the discovery of hidden connections and revealing the internal structures of complex systems.
What is Correlation Analysis?
Correlation analysis is a statistical method used to explore relationships between two or more variables. By quantifying the interdependencies among variables, it helps us understand their trends, interactions, and mutual influences. A classic example of correlation analysis in daily life is retail market basket analysis. Retailers analyze customer purchase patterns to identify associations between products—for instance, discovering that customers who buy diapers are also likely to purchase baby formula. Such insights enable optimized product placement and targeted promotions.
One of the most common correlation metrics is the Pearson Correlation Coefficient, which measures linear relationships between variables. Ranging from -1 to 1, a value of 1 indicates perfect positive correlation (e.g., ice cream sales and temperature), -1 signifies perfect negative correlation (e.g., umbrella sales and sunny weather), and 0 implies no linear relationship. However, Pearson’s coefficient has limitations—it fails to capture nonlinear relationships. To address this, methods like Spearman’s Rank Correlation and Kendall’s Tau are employed, which are robust for non-normal or nonlinear data. For example, in metabolomics data processing, researchers often use Spearman’s correlation to analyze metabolite interactions. Suppose a study investigates how glucose levels correlate with insulin secretion across patients. While Pearson might miss subtle nonlinear trends, Spearman’s method can reveal monotonic relationships, aiding in understanding metabolic pathways or disease mechanisms.

Correlation: ice cream sales and temperature
Building Correlation Networks
A correlation network is a graph-based representation of relationships among variables, where nodes represent features (e.g., genes, metabolites) and edges represent their correlations. Constructing such networks involves several key steps:
1. Data Preprocessing: Raw data is cleaned, normalized, and scaled to ensure consistency. For instance, in gene expression studies, batch effects or outliers must be removed to avoid skewed results.
2. Computing Correlation Matrices: Pairwise correlations are calculated using metrics like Pearson, Spearman, or mutual information.
3. Thresholding: To reduce noise, a correlation threshold (e.g., |r| > 0.7) is applied, filtering weak or spurious connections.
4. Graph Construction: Nodes are connected via edges if their correlation exceeds the threshold, forming an undirected or directed network.
Applications of Correlation Networks in Biology
Correlation networks have become indispensable in biological research. Below are notable examples:
Gene Co-Expression Analysis:
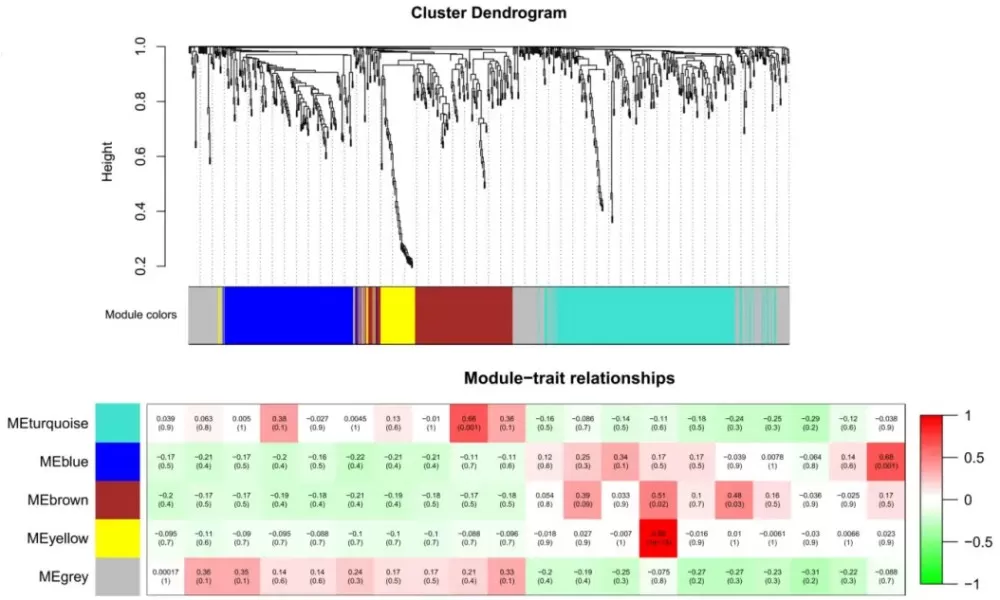
The Weighted Gene Co-Expression Network Analysis (WGCNA) algorithm is widely used to identify functional gene modules. By applying a "soft threshold" to correlation matrices, WGCNA clusters genes with similar expression patterns. For example, in cancer research, WGCNA might reveal a gene module highly correlated with tumor progression, pinpointing hub genes like ‘TP53’ or ‘BRCA1’ as potential therapeutic targets.

WGCNA for transcriptome data
Microbial Ecology:
Using 16S/18S rRNA sequencing data, microbial interaction networks are built to identify keystone species. For instance, in soil microbiome studies, a network might show ‘Pseudomonas’ and ‘Bacillus’ species exhibiting strong positive correlations, suggesting cooperative roles in nutrient cycling. Conversely, negative correlations could indicate competitive exclusion. Such networks often follow a power-law distribution, reflecting non-random community assembly.
Complex Disease Mechanisms:
Correlation networks help map disease progression pathways. In metabolic syndrome research, networks constructed from patient data might reveal that obesity and insulin resistance are central nodes, with edges linking them to comorbidities like hypertension. Gender or ethnicity-specific network patterns can further refine personalized treatment strategies.
Genome-Wide Association Studies (GWAS):
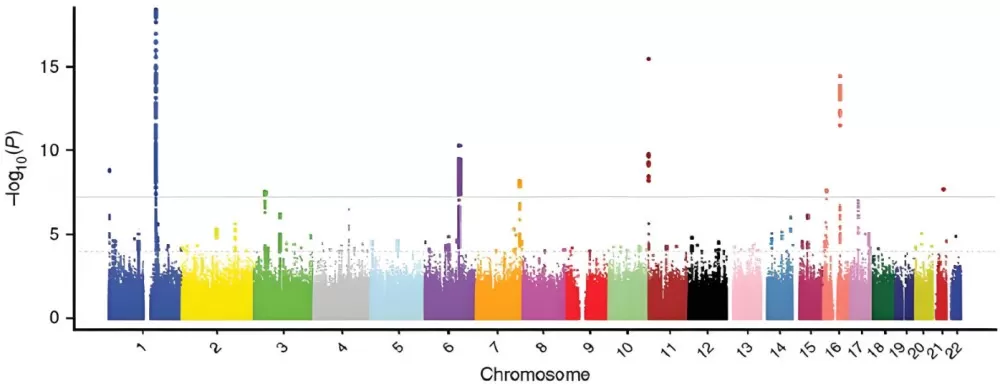
Metabolite Genome-Wide Association Studies (mGWAS) leverage correlation networks to identify genetic loci regulating metabolite levels. For example, in plant science, mGWAS has uncovered SNPs associated with drought-resistant metabolites in crops like rice, enabling targeted breeding programs. Clinically, this approach efficiently links genetic variants to biomarkers for diseases like diabetes.

mGWAS Manhattan Plot
Challenges and Future Directions
Despite their utility, correlation networks face several challenges:
1. Noise and Redundancy:
High-dimensional datasets (e.g., transcriptomics) often contain noise, leading to false-positive edges. Advanced filtering techniques, such as bootstrapping or Bayesian networks, are being developed to enhance reliability.
2. High-Dimensional Data Scalability:
Traditional methods struggle with datasets containing thousands of variables. Solutions like sparse correlation algorithms or cloud-based distributed computing are gaining traction.
3. Dynamic and Context-Dependent Relationships:
Biological systems are dynamic, yet most networks are static. Integrating time-series data or multi-omics layers (e.g., proteomics + metabolomics) will provide deeper insights.
Correlation analysis and networks are foundational tools for decoding complex relationships in data. From optimizing retail strategies to unraveling disease mechanisms, their applications span industries and disciplines. While challenges like noise and scalability persist, advancements in computational power and AI-driven methods are paving the way for more robust and insightful analyses. By harnessing these tools, researchers and practitioners can transform raw data into actionable knowledge, driving innovation in the age of big data.
Looking ahead, machine learning and graph neural networks (GNNs) hold promise. For instance, GNNs can learn hierarchical patterns in correlation networks, predicting novel gene-disease associations or drug interactions. Additionally, federated learning frameworks enable collaborative network analysis across institutions while preserving data privacy.
Read more
- Understanding WGCNA Analysis in Publications
- Deciphering PCA: Unveiling Multivariate Insights in Omics Data Analysis
- Metabolomic Analyses: Comparison of PCA, PLS-DA and OPLS-DA
- WGCNA Explained: Everything You Need to Know
- Harnessing the Power of WGCNA Analysis in Multi-Omics Data
- Beginner for KEGG Pathway Analysis: The Complete Guide
- GSEA Enrichment Analysis: A Quick Guide to Understanding and Applying Gene Set Enrichment Analysis
- Comparative Analysis of Venn Diagrams and UpSetR in Omics Data Visualization


