Charting the Proteome: A Comprehensive Guide to Data Analysis in Proteomics
Proteomics is a discipline that studies all the proteins within a biological system, encompassing protein identification, quantification, functional analysis, and the exploration of protein interaction networks. It serves as a complement to Genomics, which provides the blueprint of genetic information, while proteomics investigates how this genetic information is translated into biologically functional proteins and how they operate within cells and organisms.
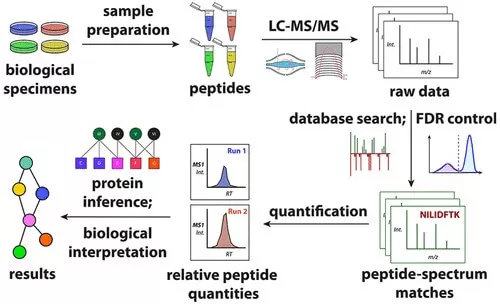
Currently, the dominant proteomics technology is bottom-up proteomics based on mass spectrometry. The fundamental research workflow includes protein extraction, proteolytic digestion, chromatographic mass spectrometry detection, and data analysis. The first three steps are experimental procedures that form the foundation for obtaining proteomic data, while the final step, achieved through various software algorithms, is crucial for revealing significant insights in proteomics. This blog will provide a detailed overview of the key components and significance of proteomics data analysis, helping researchers gain a deeper understanding of proteomic datasets.

Protein Identification
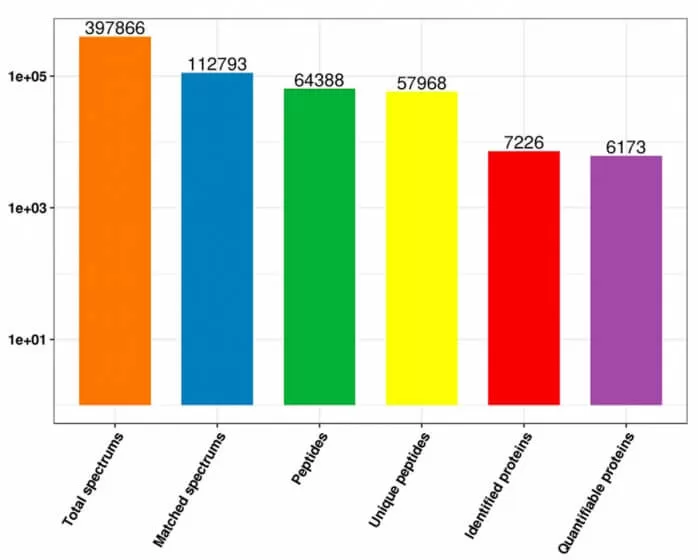
In the proteomics data analysis process, the first step involves compiling and presenting statistics on the number of spectra, peptides, and proteins detected during the experiment. The focus is primarily on the number of identified proteins, the number of identified peptides, and the number of quantified proteins, thereby providing an overview of the overall data output.

Protein Quantification
By comparing the expression levels of proteins across different samples, we can assess not only the variability in expression levels (abundance values) within a single sample but also intuitively compare the overall expression profiles of different samples. This analysis can reveal differences in protein expression between samples, typically illustrated through a combination of overall protein expression clustering heatmaps and violin plots to showcase the overall protein expression landscape.
 and Abundance Distribution Plot (Right)_1729501956_WNo_1158d563.webp)
Protein Functional Annotation
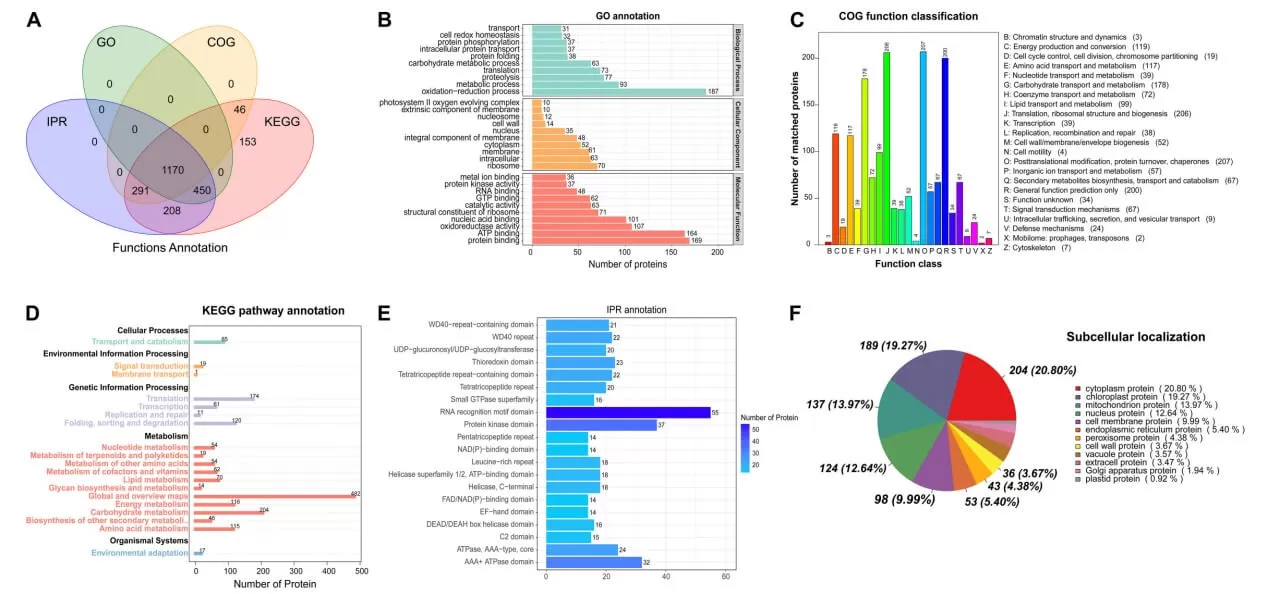
Functional annotation of proteins is conducted using databases such as GO, COG, KEGG, and InterPro, which play a crucial role in understanding the roles and biological significance of proteins within biological systems.
Gene Ontology (GO) is an internationally recognized classification system for gene functions. It aims to establish a standardized vocabulary applicable across various species to define and describe gene and protein functions, which can be updated as research progresses. GO encompasses three main categories: Molecular Function, Biological Process, and Cellular Component.
Clusters of Orthologous Groups of Proteins (COG) refers to a classification of proteins based on their orthologous relationships. Each COG comprises proteins believed to originate from a common ancestral protein. Orthologs are proteins derived from different species that have evolved through vertical descent and typically retain the same functions as their ancestral proteins. The COG database categorizes proteins into 26 functional groups.
KEGG is a primary public database related to pathways, connecting known molecular interactions in a network of information, such as metabolic pathways, complexes, and biochemical reactions. KEGG pathways include categories such as metabolism, genetic information processing, environmental information processing, cellular processes, human diseases, and drug development. Pathway analysis helps identify the main biochemical and signaling pathways that proteins participate in.
InterPro is one of the commonly used domain databases, which encompasses various well-known protein domain databases like Pfam, ProDom, and SMART. Protein domains are recurring components found within different protein molecules that exhibit similar sequences, structures, and functions, serving as units of protein evolution. Studying protein domains is essential for understanding the biological functions and evolutionary aspects of proteins.

PCA (Principal Component Analysis)
The principle of PCA involves compressing the original data into n principal components that describe the characteristics of the dataset. PC1 represents the most significant feature of the multi-dimensional data matrix, while PC2 describes the next most significant feature, excluding PC1, and so on for PC3 to PCn. By conducting PCA on the samples, researchers can gain a preliminary understanding of the overall protein differences between groups and the variability within each group.
Reproducibility Correlation Assessment
Reproducibility correlation assessment utilizes Pearson’s Correlation Coefficient (R) as an indicator of biological reproducibility. The closer |R| is to 1, the stronger the correlation between the two samples. This assessment allows for observation of biological replicates within groups and differences between samples across groups. Together, PCA and reproducibility correlation evaluation reflect the validity of experimental design and sampling strategy.
 and PCA Principal Component Analysis (Right)_1729502149_WNo_770d461.webp)
Differential Expression Analysis
Identifying differentially expressed proteins between sample groups is a key objective in proteomics research. Statistically, two parameters are typically used for screening differential proteins: the p-value and fold change (FC). The p-value is derived from a T-test comparing the protein quantification data of two sample groups, necessitating at least three samples per group. For groups with biological replicates greater than three, a protein is defined as significantly different if it meets the criteria of FC ≥ 1.5 or FC ≤ 0.6667, with a p-value ≤ 0.05. For projects without replicates, only the fold change criteria apply. Differential protein analysis can be visually represented through bar graphs, Venn diagrams, volcano plots, and heatmaps.
 and Venn Diagram (Top Right), Volcano Plot (Bottom Left), Heatmap _1729502225_WNo_1269d1179.webp)
Differential Protein Enrichment Analysis
This analysis utilizes results from protein functional annotations across various databases to identify biological functions and signaling pathways associated with differentially expressed proteins. By performing enrichment analysis, significant pathways can be highlighted, enabling the selection of key functional proteins. Results are effectively visualized using bar graphs or bubble plots.
 and KEGG Enrichment Bubble Chart (Right)_1729502285_WNo_1214d537.webp)
PPI (Protein-Protein Interaction) Network Analysis
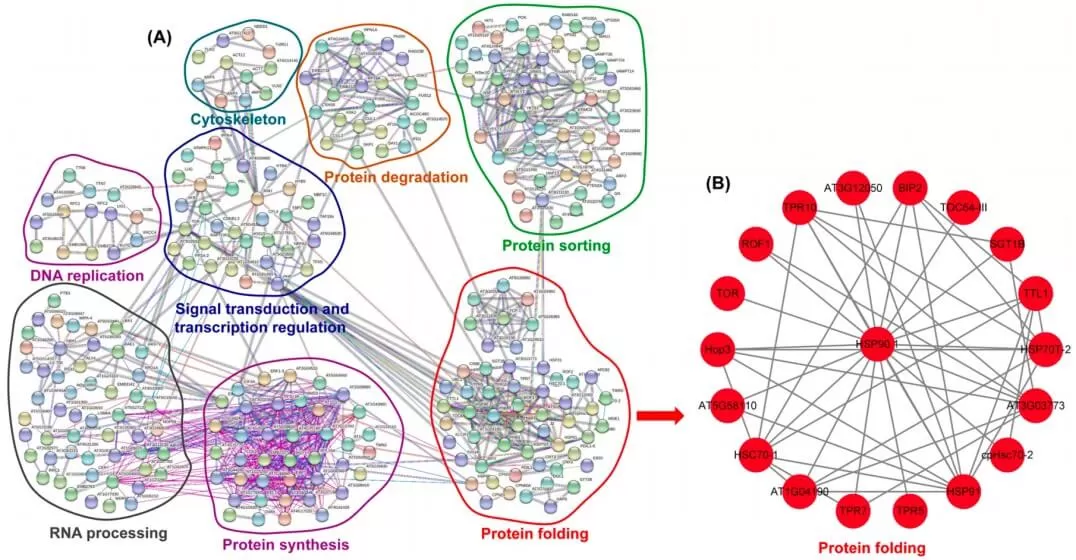
Protein interaction analysis is conducted using the StringDB database. When the target species is available, its corresponding protein sequences are extracted directly. If the species is not present, sequences from closely related organisms are used instead. The differentially expressed protein sequences undergo BLAST comparison with the extracted sequences. Based on the confidence score, interaction relationships among differentially expressed proteins are established, leading to the construction of a PPI network diagram that facilitates the identification of key nodes.

WPCNA Analysis
The WGCNA (Weighted Gene Co-expression Network Analysis) algorithm is a widely recognized approach in systems biology for constructing gene co-expression networks, relying on high-throughput messenger RNA (mRNA) expression data. WPCNA (Weighted Protein Co-expression Network Analysis) applies the WGCNA methodology to proteomics, employing the same principles for analyzing protein data.
 and Protein Co-Expression Network (Bottom)_1729502355_WNo_851d878.webp)
References
1. Shuken SR. An Introduction to Mass Spectrometry-Based Proteomics. J Proteome Res. 2023 Jul 7;22(7):2151-2171. doi:10.1021/acs.jproteome.2c00838. Epub 2023 Jun 1. PMID: 37260118.
2. Huang S, Wang B, Li N, Wang J, Yu Q, Gao J. iTRAQ and PRM -based proteomics analysis for the identification of differentially abundant proteins related to male sterility in ms-7 mutant tomato (Solanum lycoperscium) plants. J Proteomics. 2022 Jun 15;261:104557. doi: 10.1016/j.jprot.2022.104557. Epub 2022 Mar 12. PMID: 35292412.
3. Yu C, Luo X, Zhang C, Xu X, Huang J, Chen Y, Feng S, Zhan X, Zhang L, Yuan H, Zheng B, Wang H, Shen C. Tissue-specific study across the stem of Taxus media identifies a phloem-specific TmMYB3 involved in the transcriptional regulation of paclitaxel biosynthesis. Plant J. 2020 Jul;103(1):95-110. doi: 10.1111/tpj.14710. Epub 2020 Feb 21. PMID: 31999384.
4. Song C, Zhang Y, Chen R, Zhu F, Wei P, Pan H, Chen C, Dai J. Label-Free Quantitative Proteomics Unravel the Impacts of Salt Stress on Dendrobium huoshanense. Front Plant Sci. 2022 May 12;13:874579. doi: 10.3389/fpls.2022.874579. PMID: 35646023; PMCID: PMC9134114.
5. Lin R, Zhang L, Yang X, Li Q, Zhang C, Guo L, Yu H, Yu H. Responses of the Mushroom Pleurotus ostreatus under Different CO2 Concentration by Comparative Proteomic Analyses. J Fungi (Basel). 2022 Jun 21;8(7):652. doi: 10.3390/jof8070652. PMID: 35887408; PMCID: PMC9321156.
6. Ren H, Yang W, Jing W, Shahid MO, Liu Y, Qiu X, Choisy P, Xu T, Ma N, Gao J, Zhou X. Multi-omics analysis reveals key regulatory defense pathways and genes involved in salt tolerance of rose plants. Hortic Res. 2024 Mar 2;11(5):uhae068. doi: 10.1093/hr/uhae068. PMID: 38725456; PMCID: PMC11079482.
7. Kuang L, Yan T, Gao F, Tang W, Wu D. Multi-omics analysis reveals differential molecular responses to cadmium toxicity in rice root tip and mature zone. J Hazard Mater. 2024 Jan 15;462:132758. doi: 10.1016/j.jhazmat.2023.132758. Epub 2023 Oct 11. PMID: 37837773.
8. Zheng L , Wu W , Chen Q ,et al.Integrated transcriptomics, proteomics, and metabolomics identified biological processes and metabolic pathways involved in heat stress response in jojoba[J].Industrial Crops and Products, 2022(183-):183.DOI:10.1016/j.indcrop.2022.114946.
9. Yang X , Li S , Li X ,et al.Comparative proteomics reveals the response and adaptation mechanisms of white Hypsizygus marmoreus against the biological stress caused by Penicillium[J].Food Science and Human Wellness, 2024, 13(3):1645-1661.
Next-Generation Omics Solutions:
Proteomics & Metabolomics
Ready to get started? Submit your inquiry or contact us at support-global@metwarebio.com.


