
Canonical Correlation Analysis (CCA) for Multi-Omics Data Integration
What is Canonical Correlation Analysis (CCA)?
Canonical Correlation Analysis (CCA) is a multivariate statistical method designed to investigate the linear relationships between two sets of variables. By identifying linear combinations (called ‘canonical variates’) from each set that maximize their pairwise correlations, CCA reveals the "optimal" association patterns between the groups. Inspired by principal component analysis (PCA), CCA replaces original variables with a few representative composite indicators (linear combinations) to concentrate the inter-set correlations into these canonical pairs.
Suppose we have two sets of variables X and Y containing p and q variables respectively. The goal of CCA is to find vectors a and b such that the correlation between the linear combinations U=aTX and V=bTY is maximized. Mathematically, this can be expressed as:
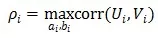
Here, ρ is the typical correlation coefficient, which represents the correlation between U and V. The above objective is performed continuously until the correlation between the two sets of variables is extracted for the ith time.
Applications of CCA in Bioinformatics
CCA has become indispensable in bioinformatics for uncovering hidden relationships in complex biological datasets. Below are key applications:
1. Gene Expression and Clinical Phenotype Association
In cancer research, integrating gene expression data (e.g., transcriptomics) with clinical phenotypes (e.g., tumor size, survival time) is critical. CCA identifies gene expression patterns most strongly correlated with clinical outcomes, aiding in biomarker discovery. Example: A study using CCA linked specific gene clusters to chemotherapy resistance in breast cancer patients, guiding personalized treatment strategies.
2. Microbial Community and Environmental Factor Analysis
In microbiome studies, CCA analyzes how environmental factors (e.g., temperature, pH) influence microbial community composition. This helps predict ecosystem responses to environmental changes. Example: Researchers applied CCA to soil microbiome data, revealing that nitrogen levels and moisture drive microbial diversity in agricultural systems.
3. Multi-Omics Data Integration
CCA bridges multi-omics datasets (genomics, proteomics, metabolomics) to uncover cross-layer interactions. For instance, integrating metabolomic and transcriptomic data via CCA can pinpoint metabolic pathways regulated by specific genes. Example: A 2022 study used CCA to connect lipid metabolism genes with plasma metabolite levels, uncovering novel regulators of cardiovascular disease.
Case Study: Integrating Transcriptomics and Metabolomics Data
Objective: Explore relationships between gene expression X and metabolite abundance Y in a cohort of diabetic patients.
1) Data Preparation
First, we need to prepare two sets of data. Suppose X is an n*p matrix representing p gene expression levels for n samples, and Y is an n*q matrix representing q metabolite accumulations for n samples.
2) Implementing CCA in R
The `CCA` package in R simplifies analysis. Below is an annotated workflow:
# Install and load the CCA package
install.packages("CCA")
library(CCA)
# Assume dataX (gene expression) and dataY (metabolites) are preprocessed
# Method 1: Standard CCA
result <- cc(dataX, dataY)
# Method 2: Regularized CCA (for high-dimensional data)
# Estimate optimal regularization parameters (λ1, λ2)
regul <- estim.regul(dataX, dataY, pit = FALSE)
result <- rcc(dataX, dataY, regul$lambda1, regul$lambda2)
# Interpret results
print(result$cor) # Canonical correlation coefficients
print(result$xcoef) # Coefficients for X-set variables
print(result$ycoef) # Coefficients for Y-set variables
print(result$scores$corr.X.xscores) # Loadings: X variables vs. canonical variates
print(result$scores$corr.Y.xscores) # Cross-loadings: Y variables vs. canonical variates
# Visualize correlations
plt.cc(result, d1 = 1, d2 = 2, type = "v", var.label = TRUE)
Visualization Notes:
- Axes represent correlations between variables and canonical variates (U1, U2).
- Points farther from the origin indicate stronger associations.
- Purple (genes) and red (metabolites) clusters highlight group-specific trends.

CCA for Conjoint metabolome and transcriptome data
3) Interpreting Results
- Canonical Correlation Coefficients (cor): Quantify the strength of association between variate pairs.
- Variable Coefficients (coef): Weights reflect each variable’s contribution to the canonical variate.
- Loadings and Cross-Loadings (corr.X.xscores and corr.Y.xscores): Absolute values >0.3 typically signify meaningful associations.
CCA vs. Regularized CCA
CCA is suitable for low-dimensional data and reveals the association by maximizing the correlation of linear combinations of two variables, but is prone to overfitting or computational instability in high-dimensional data. Regularized CCA introduces regularization parameters to solve the challenge of high-dimensional data and improves the model robustness, but it needs to be tuned by cross-validation and has higher computational complexity.
Key Differences for CCA vs. Regularized CCA
|
Aspect |
CCA |
Regularized CCA (RCCA) |
|
Dimensionality |
Suitable for low-dimensional data (p,q≪n) |
Handles high-dimensional data (p,q≥n) |
|
Stability |
Prone to overfitting in high dimensions |
Regularization ensures stable solutions |
|
Parameter Tuning |
None required |
Requires cross-validation for λ1,λ2 |
|
Use Case |
Exploratory analysis |
High-dimensional omics data integration |
Canonical Correlation Analysis is a powerful tool for decoding complex relationships between variable sets. In bioinformatics, it bridges gaps between genomics, metabolomics, and clinical data, offering actionable insights into disease mechanisms and therapeutic targets. While standard CCA excels in low-dimensional settings, regularized CCA extends its utility to modern high-throughput datasets. As multi-omics studies proliferate, CCA will remain pivotal in unraveling biological complexity.
References
Parkhomenko E, Tritchler D, Beyene J. Sparse canonical correlation analysis with application to genomic data integration. Stat Appl Genet Mol Biol. 2009;8:Article 1. doi: 10.2202/1544-6115.1406.
Read more
-
Understanding WGCNA Analysis in Publications
-
Deciphering PCA: Unveiling Multivariate Insights in Omics Data Analysis
-
Metabolomic Analyses: Comparison of PCA, PLS-DA and OPLS-DA
-
WGCNA Explained: Everything You Need to Know
-
Harnessing the Power of WGCNA Analysis in Multi-Omics Data
-
Beginner for KEGG Pathway Analysis: The Complete Guide
-
GSEA Enrichment Analysis: A Quick Guide to Understanding and Applying Gene Set Enrichment Analysis
-
Comparative Analysis of Venn Diagrams and UpSetR in Omics Data Visualization
Next-Generation Omics Solutions:
Proteomics & Metabolomics
Ready to get started? Submit your inquiry or contact us at support-global@metwarebio.com.
