Comprehensive Guide to Basic Bioinformatics Analysis in Proteomics
1. Introduction to Bioinformatics in Proteomics
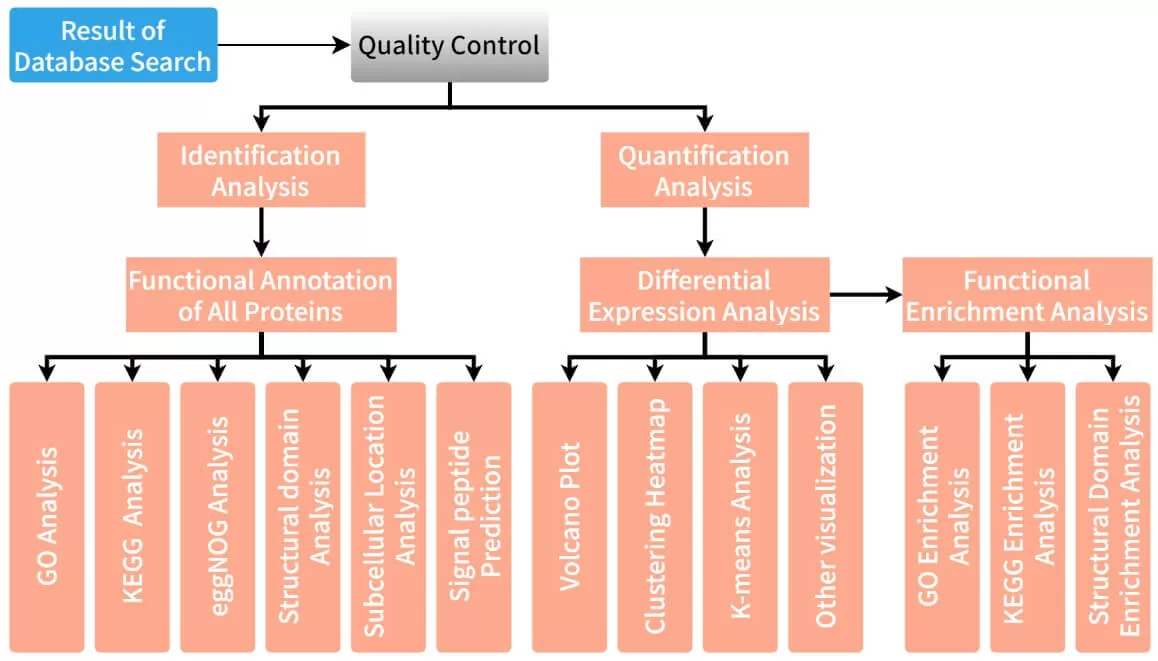
In mass spectrometry-based proteomics research, the first step involves database retrieval and analysis of mass spectrometry data to obtain qualitative and quantitative information about proteins and peptides. Following this, a rigorous quality control process is implemented to ensure the accuracy and reliability of the experimental data. Once data verification is complete, the analysis enters a critical phase of bioinformatics, further exploring the biological significance behind the data. The components of proteomic bioinformatics analysis are illustrated in the figure below.
2. Functional Analysis in Proteomics: Understanding Protein Roles
Functional analysis aims to understand the specific roles and mechanisms of different proteins within an organism. This includes their key functions in cellular signaling, metabolic pathways, molecular chaperoning, immune responses, and disease development, providing a foundation for understanding life processes, disease mechanisms, and drug development. Common protein functional analyses include Gene Ontology (GO), KEGG pathways, COG/KOG functional classification, protein domains, and subcellular localization. In proteomic bioinformatics analysis, functional annotation is performed for all identified proteins in the experiment, serving as a backdrop for subsequent differential protein functional enrichment analysis.
3. Differential Protein Expression Analysis: Methods and Tests
Differential protein analysis refers to comparing protein expression levels across different biological conditions, physiological states, or time points to identify and quantify changes in protein expression. This analysis can reveal critical biological processes and mechanisms, providing important insights for disease diagnosis, treatment, and biological research.
1) Comparisons Between Two Sample Groups:
Parametric Tests: Typically, a Student’s t-test and fold change (FC, the ratio of the average expression values between the two sample groups) are employed. P-values undergo Benjamini-Hochberg (BH) method multiple comparison correction, with differential proteins identified as having FC > 1.5 or FC < 1/1.5 and P < 0.05.
Non-parametric Tests: The Wilcoxon rank-sum test and fold change (based on median values) are commonly used, with similar P-value corrections, identifying differential proteins as those with FC > 2 or FC < 0.5 and P < 0.05.
2) Comparisons Among Three or More Sample Groups:
Parametric Tests: ANOVA is typically used, followed by BH correction, identifying differential proteins with P < 0.05.
Non-parametric Tests: The Kruskal-Wallis rank-sum test is utilized, also with BH correction, identifying differential proteins with P < 0.05.
4. Visualization Techniques for Differential Protein Analysis
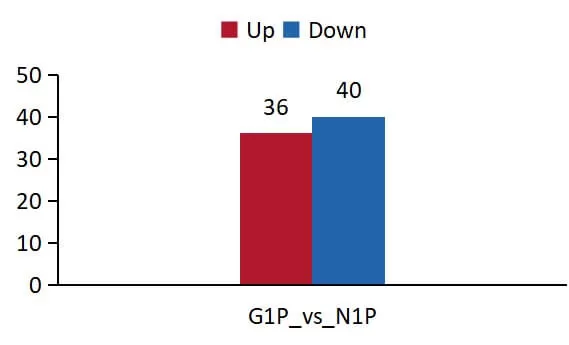
1) Differential Protein Statistics:
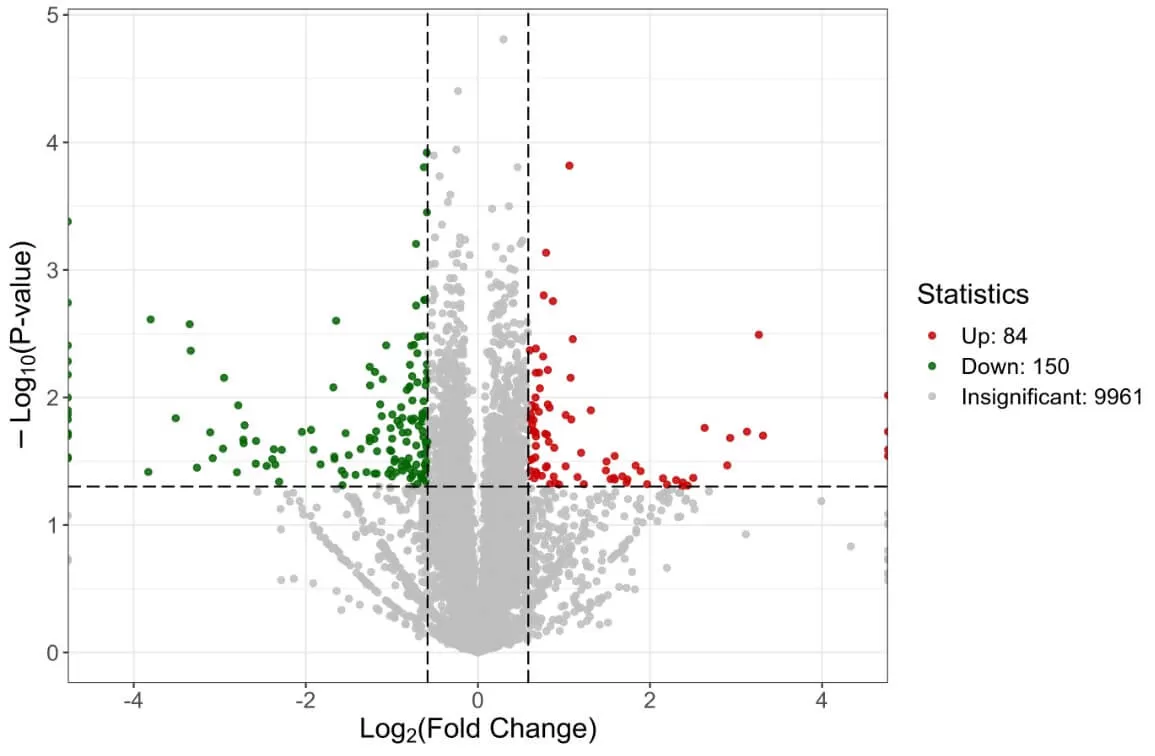
2) Volcano Plot: The volcano plot allows for a quick assessment of the differential protein expression levels and their statistical significance between two sample groups. The x-axis represents the log2 of fold change, while the y-axis represents the negative log10 of the P-value; each point represents a protein.
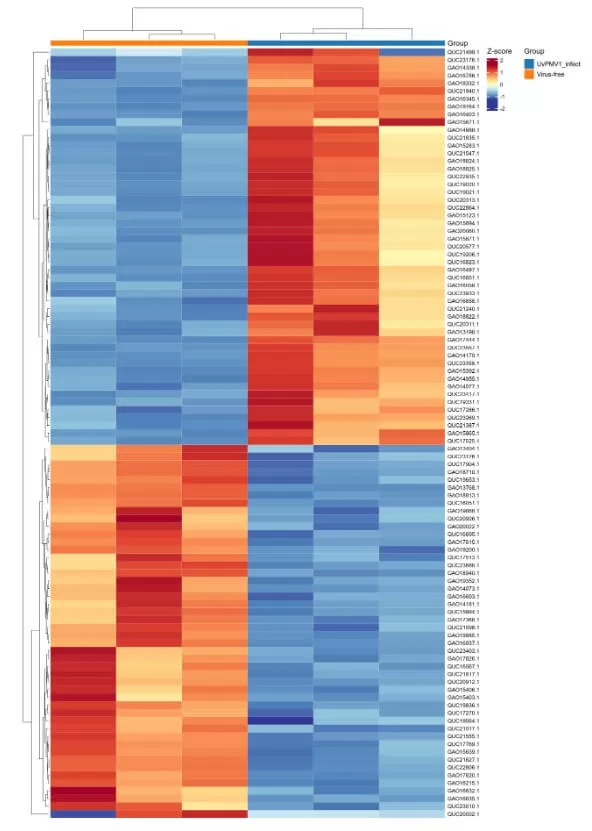
3) Clustering Heatmap: To facilitate observation of expression patterns of different differential proteins across samples, z-score normalization is performed, followed by the generation of a clustering heatmap. Row clustering reveals similarities in expression patterns among differential proteins, while column clustering indicates sample reproducibility.
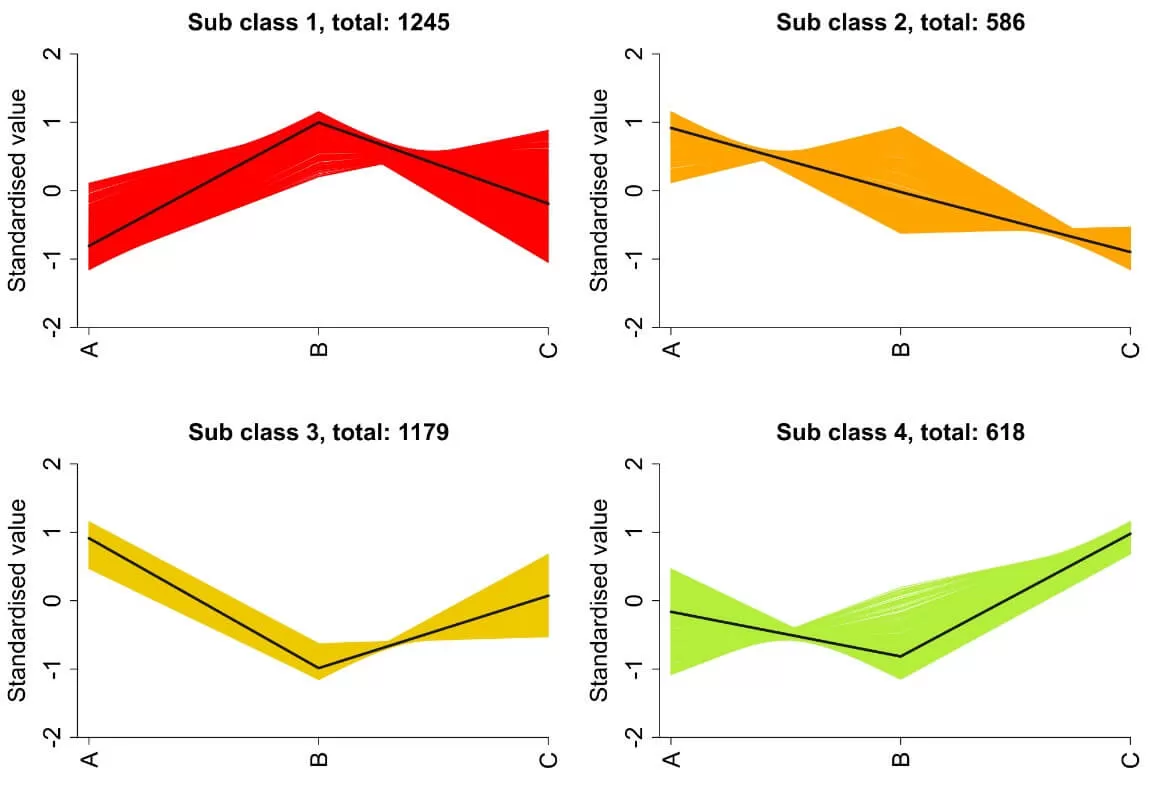
4) K-means Analysis: To investigate the trends in expression levels of differential proteins across different sample groups, quantitative values are standardized using Z-scores, followed by K-means clustering analysis.
5. Functional Enrichment Analysis of Differential Proteins
Differential proteins are annotated and analyzed using various databases. The functional annotation results for differential proteins can be extracted from the overall functional analysis of all identified proteins in the experiment, followed by hypergeometric testing for functional enrichment analysis of significantly enriched functional terms within the differentially expressed proteins.
5.1 GO Annotation and Enrichment Analysis
Gene Ontology (GO) is an internationally standardized classification system for gene functions, consisting of three main components: Biological Process, Cellular Component, and Molecular Function. The GO database provides a standardized method for describing gene functions, enhancing the understanding of how these functions operate within an organism.

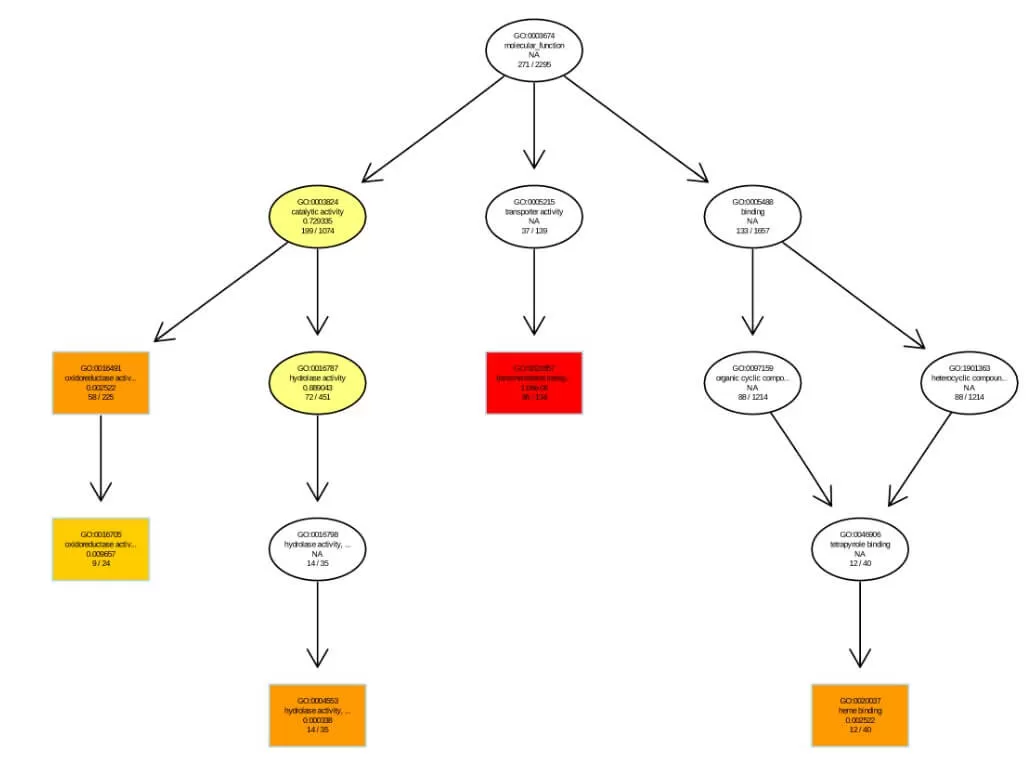
Visual representation of GO enrichment analysis results are as follows, with separate illustrations for each Level 1 GO (Biological Process, Cellular Component, Molecular Function). For directed acyclic graph of GO Enrichment: Each node represents a GO term, with rectangles indicating the top 10 enriched GO terms and ellipses representing contained nodes. The color of rectangles and ellipses reflects relative enrichment, from bright yellow (high P-values) to dark red (low P-values), indicating significance. Each node displays four lines of data, representing the GO term ID, functional description, adjusted P-value, and the count of differentially expressed proteins versus the total number of differentially expressed proteins.
5.2 KEGG Annotation and Enrichment Analysis
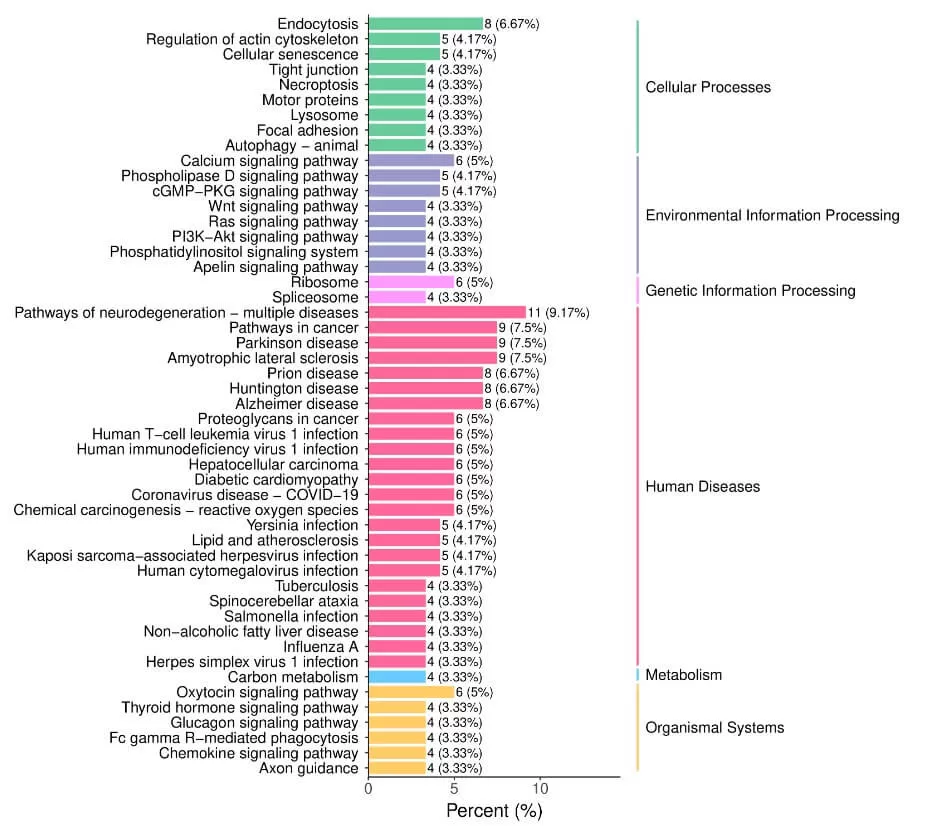
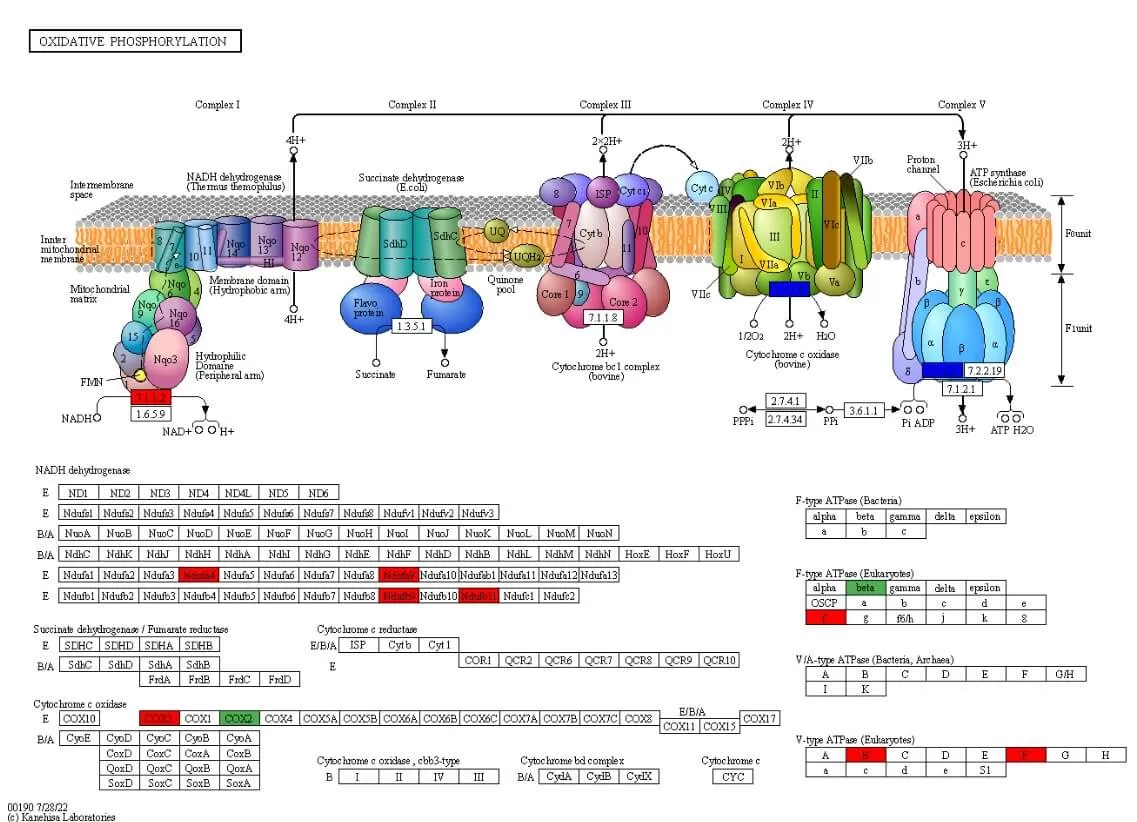
Different proteins within an organism coordinate to perform biological functions, and pathway-based analysis aids in further understanding these functions. KEGG is a primary public database for pathways, serving as an information network connecting known molecular interactions such as metabolic pathways, complexes, and biochemical reactions. KEGG pathways encompass areas including metabolism, genetic information processing, environmental information processing, cellular processes, human diseases, and drug development. Pathway analysis can identify the main biochemical metabolic pathways and signal transduction pathways in which proteins participate.
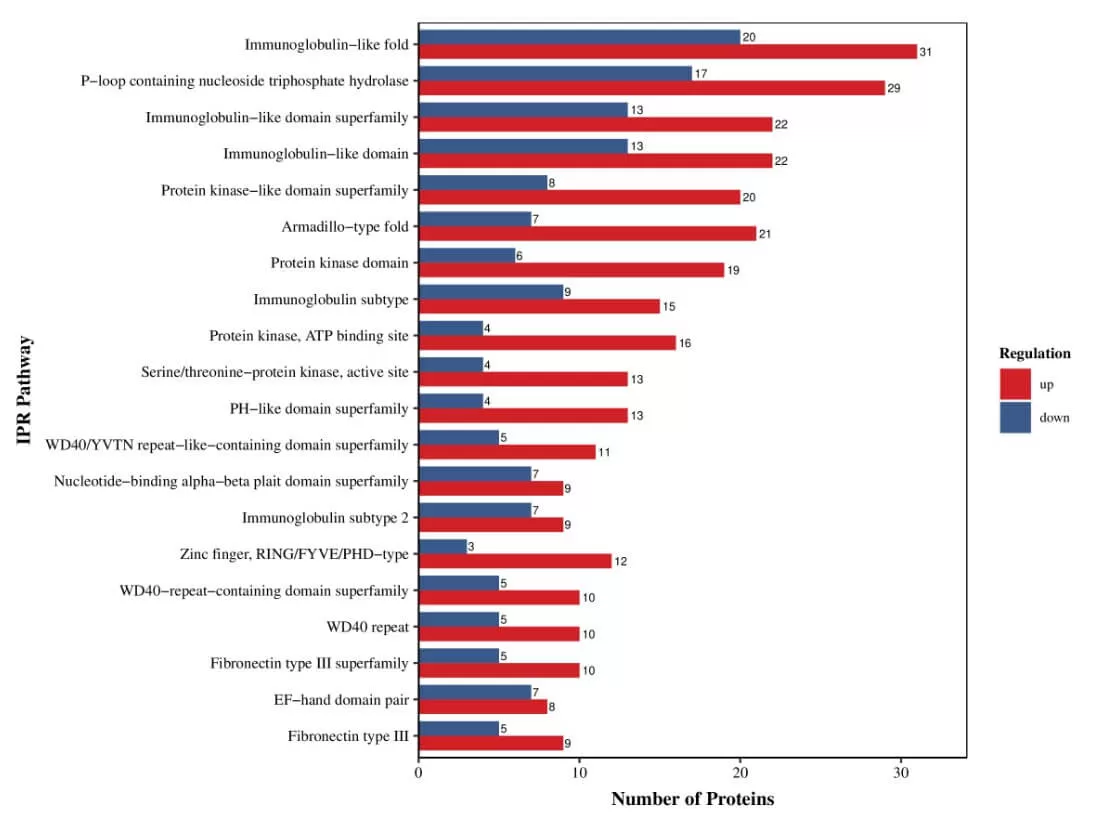
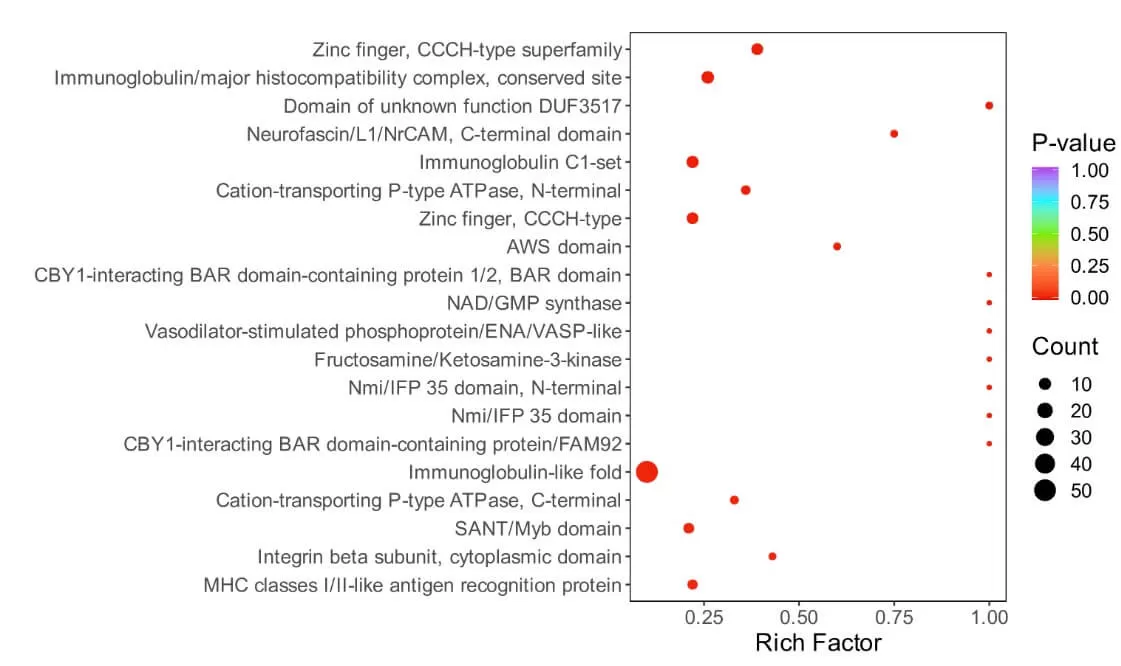
5.3 Domain Annotation and Enrichment Analysis
Protein domains are components that reappear in various protein molecules, possessing similar sequences, structures, and functions; they are units of protein evolution. The distribution of different domain combinations does not adhere to random models; some combinations exhibit strong capabilities while others rarely interact with other domains. Studying protein domains is crucial for understanding protein biological functions and evolution. InterPro (Finn et al. 2017) is one of the commonly used domain databases, encompassing other frequently utilized protein domain databases such as Pfam, ProDom, and SMART.
5.4 Subcellular Localization Analysis
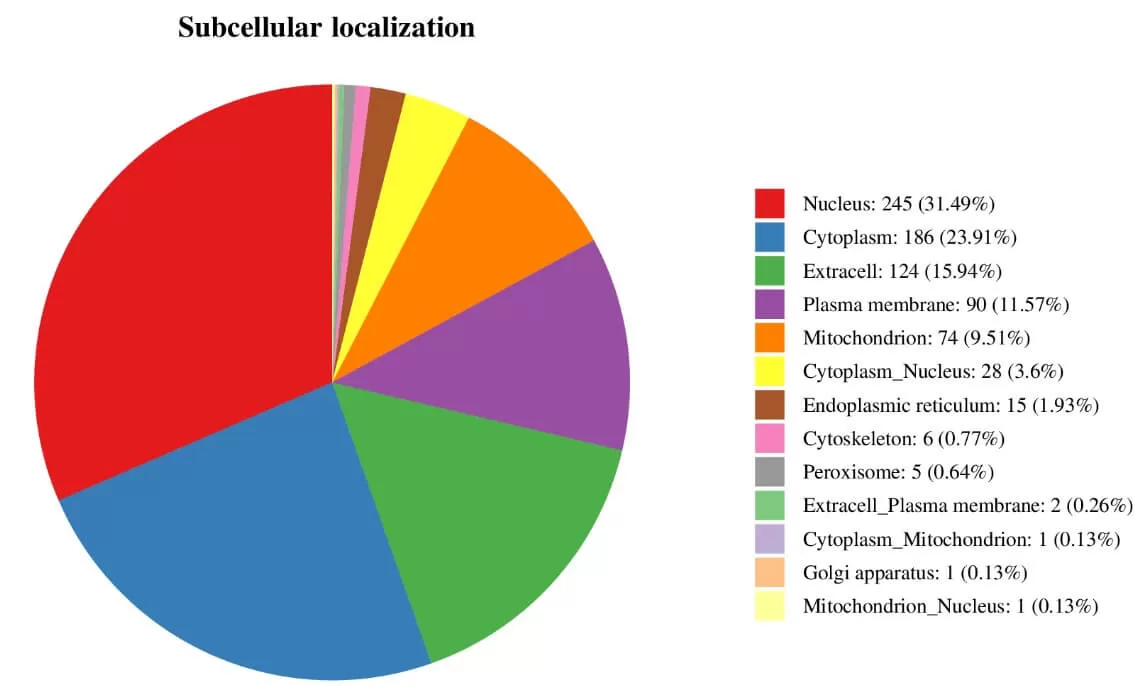
Cells within an organism are highly organized structures that can be divided into various organelles or cellular regions based on spatial distribution and function, including the nucleus, Golgi apparatus, endoplasmic reticulum, mitochondria, cytoplasm, and cell membrane. Proteins synthesized in ribosomes are transported to specific organelles through protein sorting signals; some proteins are secreted outside the cell while others remain in the cytoplasm. Understanding protein subcellular localization is vital for comprehending the biological functions of proteins.
6. Protein Interaction Network Analysis in Proteomics
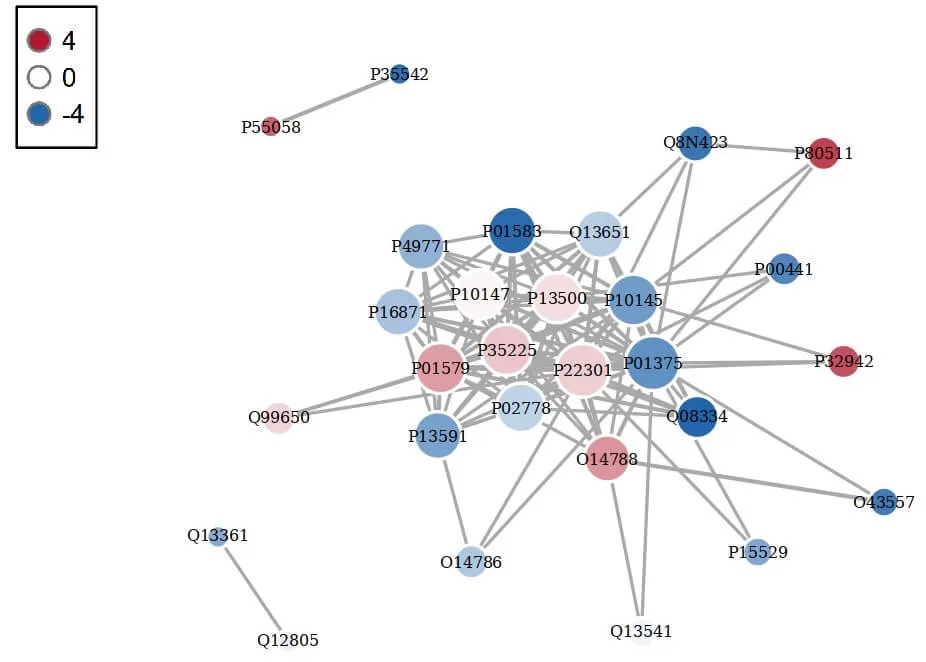
Proteins within an organism typically do not act in isolation; they need to work collaboratively with other proteins to fulfill their biological roles. This collaboration relies on the binding or interaction between proteins. Investigating these interactions and the resulting functional networks is essential for understanding how proteins execute their biological functions. The StringDB protein interaction database can be utilized for protein-protein interaction (PPI) analysis; highly clustered proteins may possess similar functions, while proteins with high connectivity may serve as key points influencing the overall metabolic or signaling pathways in the system.
Next-Generation Omics Solutions:
Proteomics & Metabolomics
Ready to get started? Submit your inquiry or contact us at support-global@metwarebio.com.


