Multi-Omics Association Analysis (I): Exploring Proteomics and Post-Translational Modifications
The Role of Post-Translational Modifications in Proteomics
Almost every protein undergoes post-translational modification (PTM), which greatly enhances protein diversity. PTM refers to the covalent processing of proteins after translation, where chemical groups are added to one or more amino acid residues, altering the physicochemical properties of the protein. This, in turn, affects the protein's spatial conformation, active state, subcellular localization, and interactions with other proteins. More than 300 types of known post-translational modifications exist, with common types including phosphorylation, acetylation, ubiquitination, N-glycosylation, and methylation. These modifications can rapidly and reversibly respond to stimuli from both inside and outside the cell, making them significantly valuable in fields such as medicine, life sciences, and botany.
Why Association Analysis of Proteomics and PTM is Critical
Protein functionality is primarily regulated by its expression levels and the status of post-translational modifications. Studying these aspects in isolation may provide a limited perspective; thus, it is necessary to conduct association analyses between quantitative proteomics and PTM proteomics. This approach aids in systematically understanding how proteins change under different conditions, including variations in specific physiological or disease states. For instance, in certain disease conditions, a protein's abundance may remain unchanged while its modification levels vary significantly, indicating that the protein primarily responds to external stimuli through modification rather than abundance changes. Such analyses deepen our understanding of the complex mechanisms governing protein function and offer new perspectives for disease diagnosis and treatment.
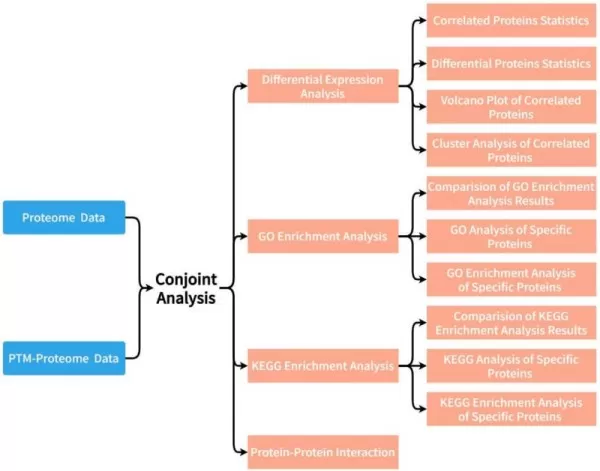
Display of Analysis Results
1) Key Insights from Differential Expression Analysis of Proteins and PTMs
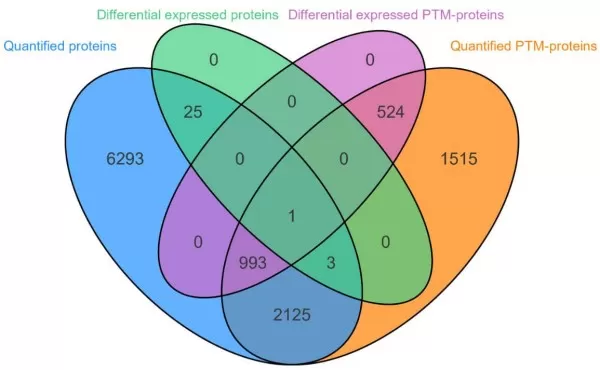
This includes the statistics on the number of proteins detected in the two groups including counts of associated proteins and Venn plot.
| Comparison groups | Quantified proteins | Differentially expressed proteins | Quantified PTM-proteins | Differentially expressed PTM-proteins | Correlated proteins | Correlated proteins (Differential expression only in Proteome) | Correlated proteins (Differential expression only in PTM-proteome) | Correlated proteins (Differential expression in both) |
| B_vs_A | 9440 | 29 | 5161 | 1518 | 3122 | 4 | 993 | 1 |
| C_vs_A | 9443 | 42 | 5152 | 1046 | 3117 | 9 | 678 | 6 |
| C_vs_B | 9435 | 27 | 5162 | 1345 | 3122 | 1 | 872 | 0 |
| C_vs_B_vs_A | 9452 | 235 | 5177 | 3426 | 3130 | 57 | 2075 | 51 |
| State | Unchanged (Proteins) | Upregulated (Proteins) | Downregulated (Proteins) |
| Unchanged (PTM-proteins) | 347 | 9 | 12 |
| Upregulated (PTM-proteins) | 40 | 30 | 6 |
| Downregulated (PTM-proteins) | 55 | 25 | 9 |
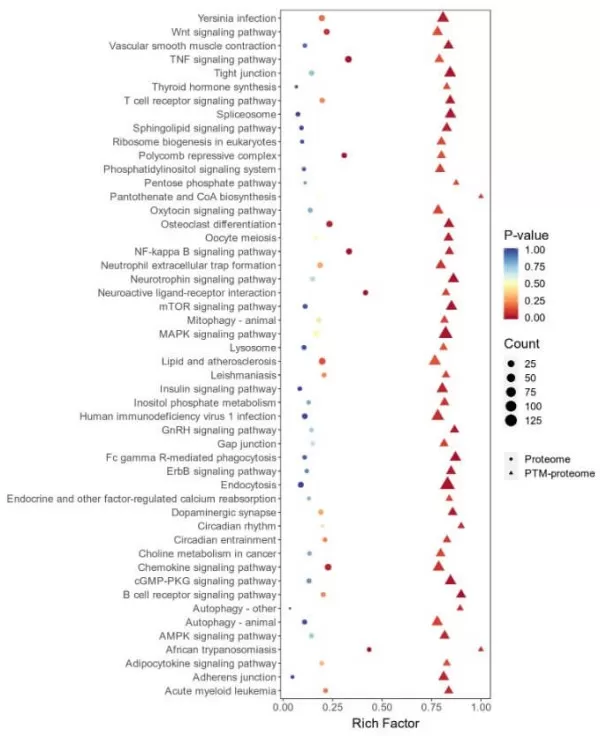
2) Functional Annotation: GO/KEGG Enrichment Analysis
Comparison of GO/KEGG enrichment analysis results from both groups:
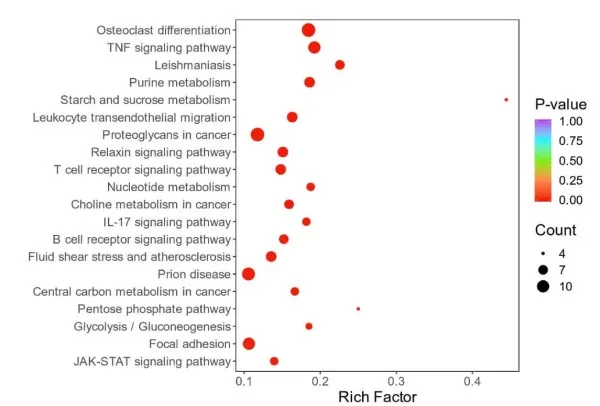
3) Special Classification of Protein GO/KEGG Enrichment Analysis
Proteins showing differential modifications were analyzed separately for GO and KEGG enrichment, focusing on those with differences only in modification levels and those with differences in both protein and modification levels, followed by visualization of the enrichment results.
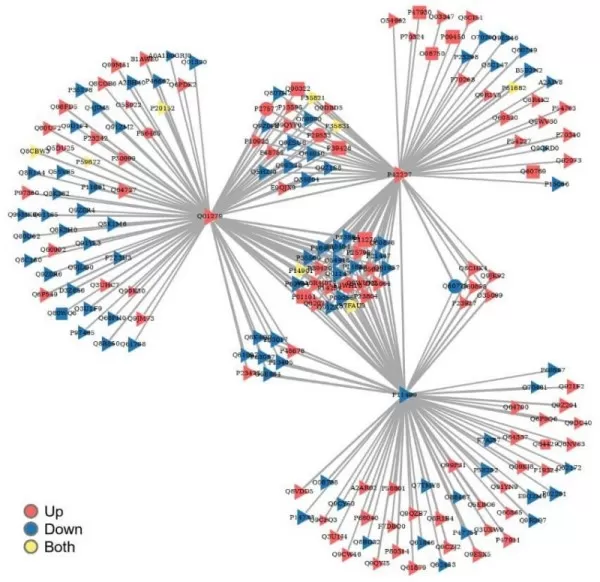
4) Visualizing Protein Interaction Networks in Multi-Omics Analysis
In the PPI network diagram, each node represents a differentially expressed protein, with varying shapes indicating significant differences across different omics, and different colors representing the states of significant differences.
Next-Generation Omics Solutions:
Proteomics & Metabolomics
Ready to get started? Submit your inquiry or contact us at support-global@metwarebio.com.


