Step-by-Step Guide to Multi-Omics Association Analysis in Metabolomics and Microbiomics
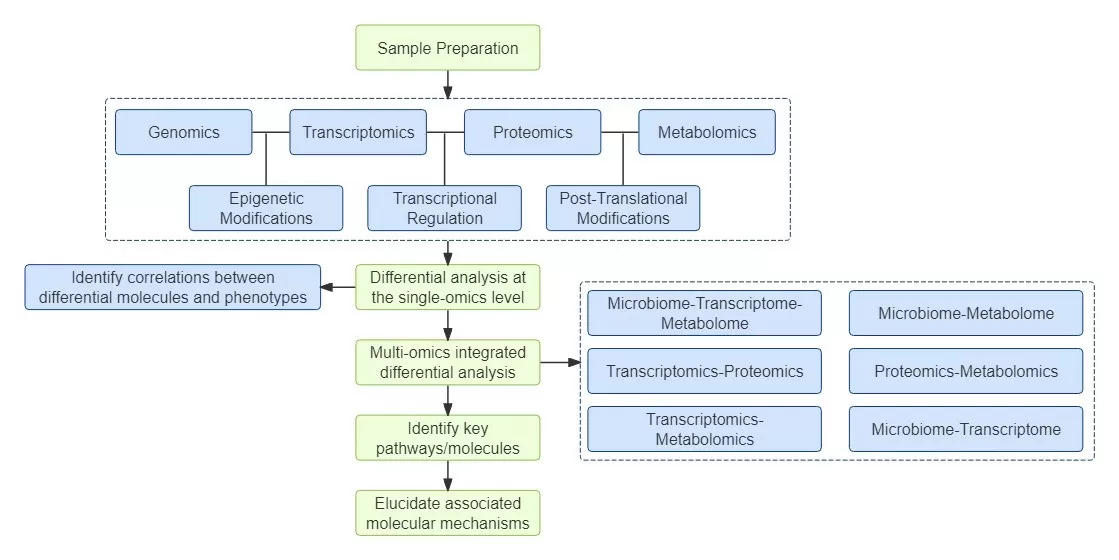
Multi-omics research employs two or more omics technologies, such as genomics, transcriptomics, and proteomics, to conduct comprehensive studies. The core objective is to identify combinatorial biomarkers through correlation analysis and in-depth exploration of multi-omics data. By employing a multi-omics approach, researchers can achieve a holistic understanding of biological systems, as this method allows for the investigation of complex interactions between various molecular layers. This integration facilitates the identification of potential therapeutic targets and enhances our understanding of disease mechanisms, paving the way for personalized medicine and more effective treatment strategies.

Multi-omics research primarily consists of two components: 1) correlation analysis based on statistical methods (for example, in studies involving microbial diversity and metabolomics); and 2) correlation analysis based on metabolic pathway analysis (as exemplified by studies integrating transcriptomics and metabolomics). The first component focuses on leveraging statistical techniques to identify relationships among various biological variables. For instance, in microbial diversity studies, researchers can assess how changes in microbial communities correlate with specific metabolic profiles. The second component emphasizes the importance of metabolic pathways in elucidating the interplay between gene expression and metabolite production. By integrating transcriptomic/proteomic and metabolomic data, researchers can identify key regulatory pathways that link gene expression to metabolic outputs.
In this blog, we will demonstrate how to conduct multi-omics association analysis for microbiomes and metabolomes using the Metware Cloud platform, featuring a detailed example. This step-by-step guide will provide readers with a comprehensive understanding of effectively implementing multi-omics approaches, showcasing the powerful capabilities of Metware Cloud for seamless analysis and insights.
Correlation Heatmap
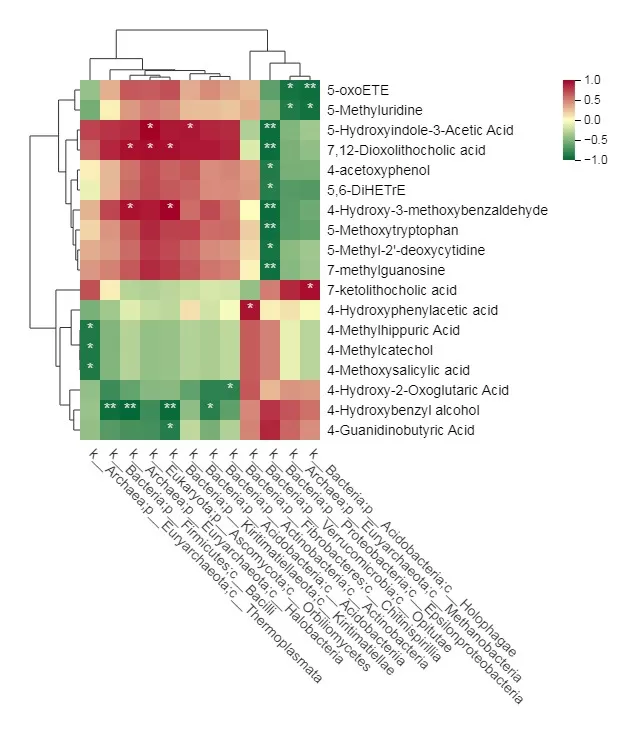
The correlation heatmap is a powerful visualization tool used to represent the relationship between two sets of variables in a matrix format. Each cell in the heatmap corresponds to the correlation coefficient between a pair of variables—such as a metabolite and a microorganism—with color gradients used to reflect the strength and direction of the correlation. Positive correlations are typically represented by warmer colors (such as red), while negative correlations are shown with cooler colors (such as green). The closer the value is to 1 or -1, the stronger the correlation. In contrast, values close to 0 indicate a weak or no correlation.
The correlation heatmap can be generated using the “Advanced Correlation Clustering Heatmap (Multi-omics)” tool on the Metware Cloud platform by calculating the correlation coefficients and significance (p-values) between two omics datasets, either through Pearson correlation or Spearman rank correlation analysis. The process involves the following steps:
1. Prepare the data matrices for differential metabolites and microbiota.
2. Upload the two datasets to the tool.
3. Set the necessary parameters, such as the p-value threshold, correlation coefficient threshold, and the correlation method.
4. Click "Submit" to initiate the analysis, and the results will be available under "My Analysis."
The output includes tables displaying the correlation coefficients (r values) and p-values for the two datasets, along with a correlation heatmap. Each cell of the heatmap visually represents the strength and direction of the correlation between variables from the two datasets, as illustrated in the following figures.
Table 1: Correlation Coefficients (r values) Between Differential Metabolites and Differential Microorganisms
 Between Differential Metabolites and Differential Microorganisms_1729217444_WNo_750d390.webp)
Table 2: Significance (p-values) of the Correlation Between Differential Metabolites and Differential Microorganisms
 of the Correlation Between Differential Metabolites and Differential Microorganis_1729217456_WNo_750d392.webp)

The Correlation Clustering Heatmap reveals a highly significant negative correlation between the metabolite 5-oxoETE and the microbiota classified as k_Bacteria;p_Acidobacteria;c_Holophagae. Additionally, several other metabolites and microbiota are indicated by cells marked with an asterisk (*), signifying noteworthy correlations.
Correlation Scatter Plot
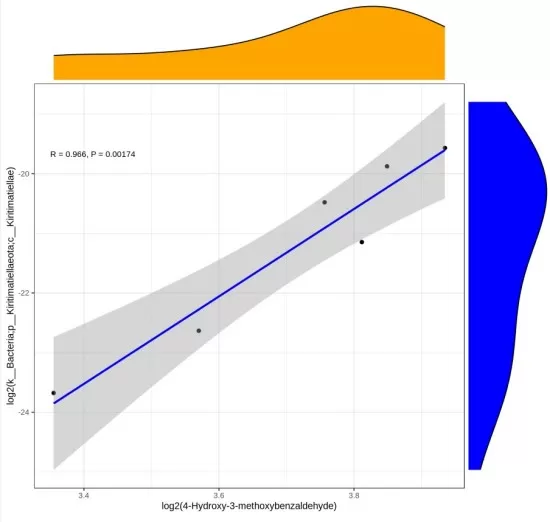
The correlation scatter plot is a commonly used method in correlation analysis, offering an intuitive way to visualize the relationship between two variables. If the two variables are perfectly linearly correlated, the data points will fall directly on the fitted line; if they are partially correlated, the points will scatter on either side of the line; and if there is no linear correlation, the data points will be dispersed without any clear pattern. By calculating the correlation between the two omics datasets for each sample, the scatter plot helps assess the distribution across samples, fit a linear regression model, and compute the correlation coefficient. Figure 2 provides an example of the correlation analysis between a specific metabolite and a microorganism.
The correlation scatter plot can be generated using the “Advanced Correlation Scatter Plot (Multi-omics)” tool on the Metware Cloud platform. The process involves the following steps:
1. Prepare the data matrices for differential metabolites and microbiota.
2. Upload the two datasets to the tool.
3. Set the necessary parameters, such as the correlation method and the image size&color.
4. Click "Submit" to initiate the analysis, and the results will be available under "My Analysis."
The results will display scatter plots for the top correlated variable pairs, ranked by correlation strength, along with a table showing their correlation coefficients. Below is a scatter plot example for one metabolite and one microorganism.

From this result, the metabolite 4-Hydroxy-3-methoxybenzaldehyde exhibits a strong positive correlation with the microorganism k__Bacteria-p__Kiritimatiellaeota-c__Kiritimatiellae, characterized by a correlation coefficient of R = 0.996 and a P-value of 0.00174.
Canonical Correlation Analysis (CCA)
Canonical Correlation Analysis (CCA) is a multivariate statistical technique used to explore the relationships between two sets of variables. It extends the concept of correlation by not only assessing the linear relationships between two variable groups but also identifying and quantifying the patterns of association. CCA is particularly useful when researchers seek to understand how two different sets of measurements are related to one another. CCA involves first selecting differential metabolites and differentially abundant microorganisms based on correlation analysis results, specifically those with Spearman correlation coefficients |r| ≥ 0.8 and a significance level of P-value < 0.05. Subsequently, this filtered set of metabolites and microorganisms is subjected to CCA to explore their interrelationships.
The CCA can be achived using the “CCA Analysis” tool on the Metware Cloud platform. The process involves the following steps:
1. Prepare the data matrices for differential metabolites and microbiota.
2. Upload the two datasets to the tool.
3. Upload the sample grouping information of the datasets
4. Set the necessary parameters, such as the VIF threshold and analysis type.
5. Click "Submit" to initiate the analysis, and the results will be available under "My Analysis."
The results will display a CCA figure as below. In the diagram, orange represents metabolites and blue represents microorganisms. The figure is divided into four quadrants by two axes. Within the same quadrant, the farther a point is from the origin, the closer the relationship between the variables, indicating a higher canonical correlation.
_1729217524_WNo_700d600.webp)
Correlation Chord Diagram
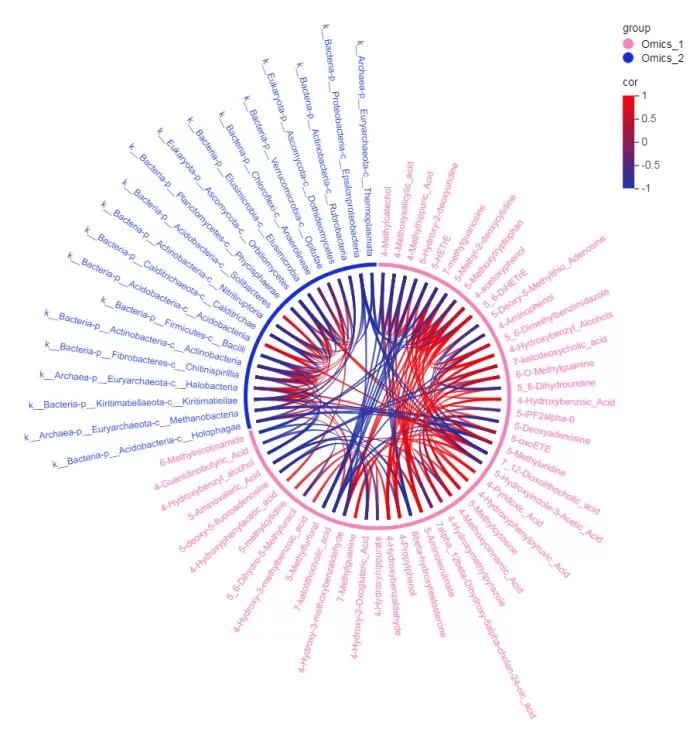
A correlation chord diagram is a powerful visualization tool used to represent relationships between multiple variables in a visually appealing and informative manner. It is particularly useful for illustrating the correlation coefficients among a set of variables, allowing for the identification of both positive and negative associations at a glance. The diagram consists of circular arcs (or chords) that connect different variables, with each arc's width and color representing the strength and direction of the correlation. Positive correlations are typically indicated by one color (e.g., red), while negative correlations may be represented by another color (e.g., blue).
The correlation chord diagram can be generated using the “Advanced Chord Chart” tool on the Metware Cloud platform. The process involves the following steps:
1. Prepare the data matrices for differential metabolites and microbiota.
2. Upload the two datasets to the tool.
3. Set the necessary parameters, such as the p-value threshold, correlation coefficient threshold, and the correlation method.
4. Click "Submit" to initiate the analysis, and the results will be available under "My Analysis."
The results will display a correlation chord diagram as below:

From the results, it indicates that microorganisms k__Archaea-p__Euryarchaeota-c__Methanobacteria and k__Bacteria-p__Acidobacteria-c__Holophagae exhibit a negative correlation with metabolite 5-oxoETE.


