MetwareBio's 4D Proteomics: Doubling Protein Detection
Introduction to MetwareBio's 4D Proteomics
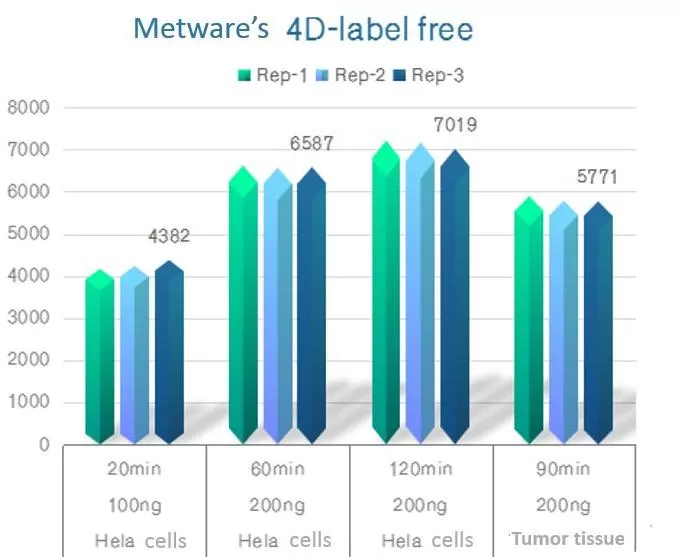 MetwareBio conducted 4D proteomic analysis on Hela cell extracts using different experimental gradients. Employing 4D-label-free quantitative proteomics technology, we identified 6,587 protein families in 200ng of Hela cell extract within a 60-minute detection gradient, surpassing the 4,972 species identified by Matthias Mann's laboratory. Utilizing 4D-DIA quantitative proteomics technology, we identified 6,623 protein families in 200ng of Hela cell extract within a 60-minute detection gradient, exceeding the 6,525 species identified by AlexeyI. Nesvizhskii's laboratory. MetwareBio's 4D proteomic detection level has reached the standards of leading international laboratories. For specific detection references, please refer to the accompanying figure.
Abundant Protein Detection with High Sample Stability
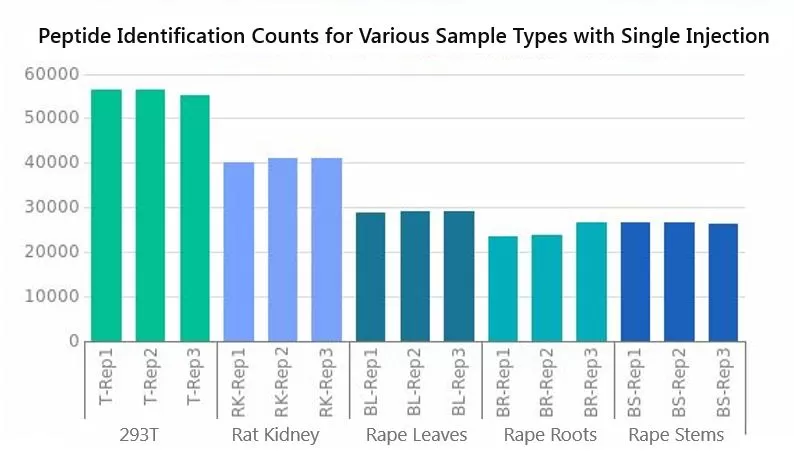
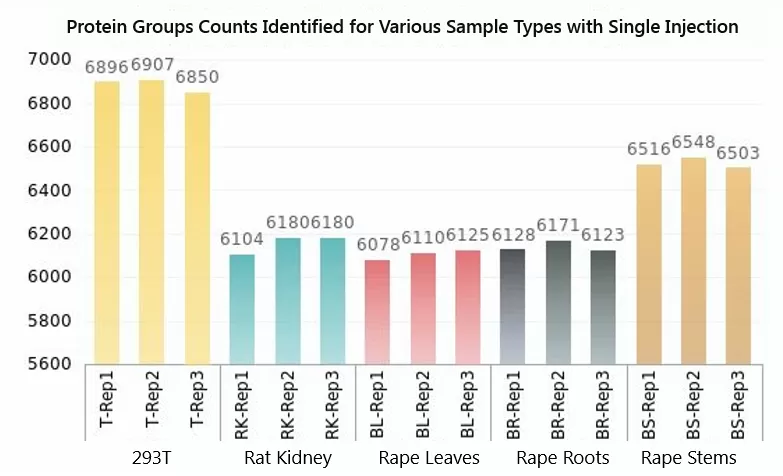
In addition to Hela cells, MetwareBio's R&D team has conducted 4D proteomic analyses on a diverse range of biological samples, including 293T cells, rat kidneys, serum/plasma, canola leaves, roots, and stems. Employing 4D-label-free quantitative proteomics technology for selected sample types, the detection levels are showcased below.
Due to variations in sample types, the number of secondary spectra collected varies, with the highest count reaching up to 240,000 and an average exceeding 190,000. The timsTOF HT instrument significantly boosts the number of secondary spectra collected, owing to its exceptional sensitivity and scanning speed. As a result, the number of identified peptide segments varies across samples, with the highest count reaching 56,381 segments. All samples consistently identified protein groups exceeding 6,000, with 293T cells and canola stems surpassing 7,000 protein groups. This underscores MetwareBio's reliability in protein detection quantity and ensures data richness.
High Qualitative Reproducibility
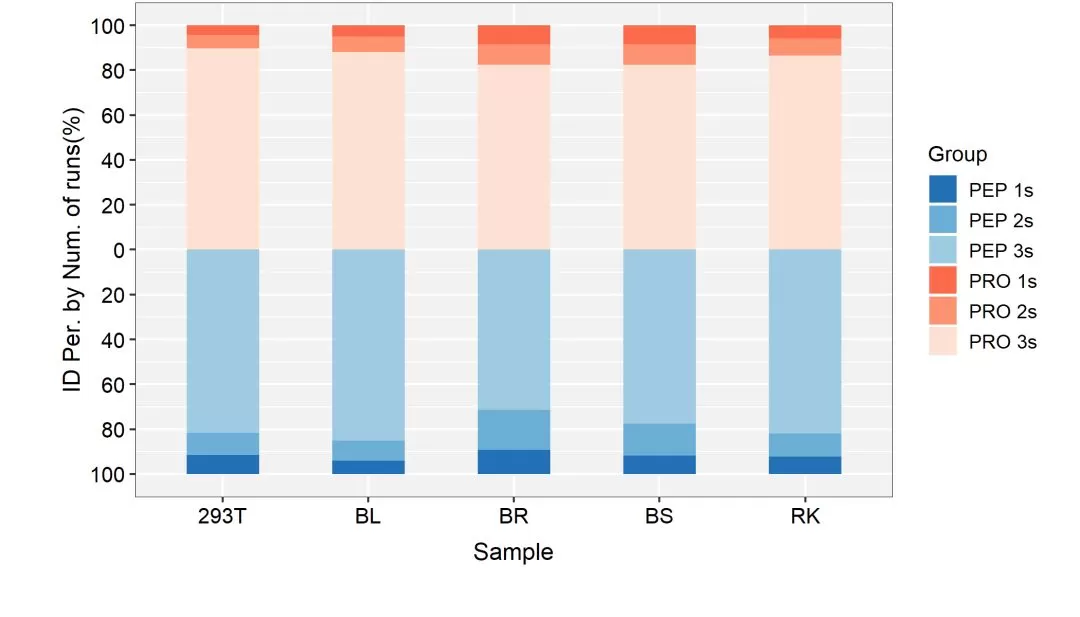
To evaluate the reproducibility of qualitative findings, we analyzed the proportions of peptides and proteins identified in each sample that were simultaneously detected in three replicates, detected in two replicates, and detected in only one replicate. The results are depicted in the figure below. On average, 85.84% of proteins identified in each sample were detected in all three replicate runs, with an average of 79.55% for peptides. This demonstrates a remarkable level of consistency. Hence, MetwareBio's 4D proteomics products exhibit superior qualitative reproducibility, greatly facilitating data mining.
High Quantitative Stability and Reproducibility
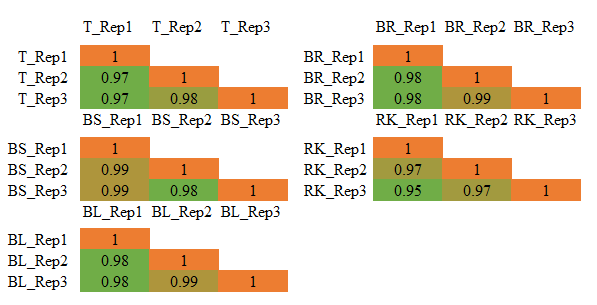
We conducted Pearson correlation analysis on 4D-label-free quantitative proteomics data from three replicates of five sample types. The results revealed excellent correlation between the quantitative values of replicate samples, with Pearson correlation coefficients mostly exceeding 0.97.
Analysis of the coefficient of variation (CV) for protein quantification showed that 95% of proteins had an average CV value of less than 20%, indicating overall low variation. This underscores the exceptional reproducibility of quantitative results.
 for Protein Quantification across Different Sample Types. BL Ra_1721377315_WNo_1031d589.webp)
Through Pearson correlation analysis and CV analysis, it is evident that MetwareBio's 4D proteomics products exhibit high quantitative stability, resulting in more reliable and reproducible data, which is advantageous for subsequent validation.
Conclusion
In conclusion, MetwareBio Metabolomics' 4D proteomics products offer numerous advantages, including high protein detection, stable sample detection, high qualitative repeatability, accurate quantification, as well as high stability and reproducibility, ensuring deep protein coverage and reliable experimental data.
Read more:
· A Guide to Protein Database Selection
· MetwareBio Launches Proteomics Services
· What is Isoelectric Points of Amino Acids: Essential Calculations and Practical Applications
· Comparison and Application of Proteomic Technologies
· Demystifying Proteomics Research Strategies and Content in a Single Read
· Optimal Protein Database Selection: Insights from Experimental Data
· Protein sample preparation tips: Serum or Plasma?
· An Overview of Mainstream Proteomics Techniques
· Exploring Disease Mechanisms: Key Factors in Proteomic Analysis
Next-Generation Omics Solutions:
Proteomics & Metabolomics
Ready to get started? Submit your inquiry or contact us at support-global@metwarebio.com.


