

Proteomics Platform Showdown: MS-DIA vs. Olink vs. SomaScan
Overview of proteomics technologies: MS-DIA vs. Olink vs. SomaScan
Proteomics has become a cornerstone of modern biomedical research, enabling scientists to decode complex biological systems by analyzing thousands of proteins at once. However, selecting the right proteomics platform can be daunting, with each technology offering unique strengths and limitations. In this blog, we break down three leading platforms—MS-DIA, Olink, and SomaScan—to help you decide which one best fits your research goals. Here is a comparison table of MS-DIA, Olink, and SomaScan for proteomic analysis of human/mouse tissue and blood samples, based on their technical features, advantages, and limitations:
Proteomics Platform Showdown: Key Features Compared
|
Feature |
|||
|
Technology |
Data-independent acquisition mass spectrometry |
Proximity Extension Assay (PEA) + PCR amplification |
Aptamer-based (SOMAmer) protein binding |
|
Throughput |
High (depends on instrument and workflow) |
High (up to 3,000–5,000 proteins with Explore HT) |
Very high (11,000+ proteins with SomaScan 11K) |
|
Protein Coverage |
Broad (untargeted, detects novel proteins and isoforms) |
Targeted (predefined panels, e.g., 3K or 5K proteins) |
Broad (predefined panels, ~7K–11K proteins) |
|
Sensitivity |
Moderate to high (detects low-abundance proteins with enrichment methods) |
High (designed for low-abundance biomarkers in complex samples) |
Moderate (limited for very low-abundance proteins) |
|
Dynamic Range |
Wide (6–7 orders of magnitude) |
Moderate (optimized for clinical ranges) |
Moderate (limited for extreme concentration differences) |
|
Quantification Type |
Relative or absolute (with spiked standards) |
Relative (normalized protein expression) |
Relative (normalized fluorescence units) |
|
Sample Requirements |
Higher input (e.g., 10–100 µg protein for tissues) |
Low input (1–3 µL serum/plasma; compatible with FFPE) |
Low input (10–50 µL plasma/serum; minimal pre-processing) |
|
Sample Types |
Tissues, cells, biofluids |
Biofluids (serum, plasma), tissues (with extraction), FFPE |
Biofluids (serum, plasma), tissues (limited compatibility) |
|
Yes (e.g., phosphorylation) |
No |
No |
|
|
Cost per Sample |
Low (instrumentation, reagents, bioinformatics) |
Moderate to high (panel-dependent) |
High (cost-effective for large cohorts) |
|
Turnaround Time |
Moderate (sample prep + LC-MS/MS analysis) |
Short (1–2 days post-sample prep) |
Moderate (high-throughput automation possible) |
|
Data Complexity |
High (requires advanced bioinformatics for DIA data processing) |
Low (processed data provided; easy integration) |
Moderate (processed data with custom analysis tools) |
|
Clinical Utility |
Limited (research-focused; validation required) |
High (validated for clinical biomarker discovery) |
High (used in large cohort studies, e.g., UK Biobank) |
|
Strengths |
|
|
|
|
Limitations |
|
|
|
No single proteomics platform is universally best. MS-DIA is generally the strongest fit for untargeted discovery, PTM analysis, and mechanistic studies across diverse sample types. Olink is often the most practical choice for sensitive, low-input profiling of predefined protein targets in plasma and other biofluids, especially in translational or cohort-based studies. SomaScan stands out in very large population-scale projects where broad predefined coverage and high throughput are priorities. In practice, the right platform depends on study goal, sample type, cohort size, and the level of biological resolution required.
For untargeted discovery, post-translational modification (PTM) analysis, and mechanistic studies, MS-DIA stands out as the gold standard, offering unparalleled flexibility across diverse sample types—including tissues (e.g., tumor biopsies, brain sections), cells, and biofluids—while also scaling efficiently for large cohorts with proper infrastructure. However, it demands advanced bioinformatics expertise. Olink excels in clinical biomarker validation, combining high sensitivity for low-abundance proteins in blood samples with rapid turnaround, making it ideal for translational research. Meanwhile, SomaScan dominates large-scale population proteomics, leveraging its ultra-high throughput to map protein-disease associations in biobank-scale studies.
To conduct a meticulous comparison of detection results across different technological platforms, we present an article detailing proteomic analyses of plasma samples utilizing seven distinct technical approaches spanning three platforms.
Comparison of Proteomics Platform Detection Results
The plasma proteome presents significant challenges as a source of biomarkers, including its wide dynamic range, difficulty in detecting and quantifying low-abundance markers, confounding factors in data interpretation, and substantial inter-individual variability. Current plasma proteomics detection primarily relies on affinity-based technologies, such as SomaScan and Olink, as well as mass spectrometry (MS)-based methods. Affinity-based platforms offer high throughput and multiplexing for predefined protein targets, while MS-based workflows measure proteolytic peptides and are better suited to unbiased discovery, post-translational modification (PTM) analysis, and protein isoform characterization. In 2025, Ahadi and colleagues published “Current landscape of plasma proteomics from technical innovations to biological insights and biomarker discovery” in Communications Chemistry, providing a head-to-head comparative evaluation of major plasma proteomics platforms.
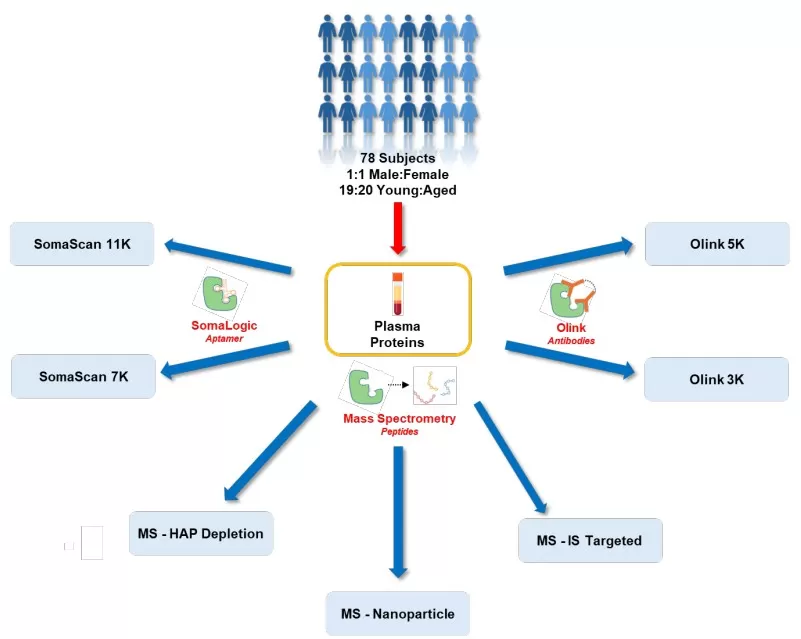
Study Overview for plasma samples analyzed using seven proteomic platforms
1. Study Design
1) Sample Collection
- Cohort characteristics: Plasma samples from 78 healthy individuals (40 aged 55–65, 38 aged 18–22; 1:1 male-to-female ratio).
- Sample processing: Sodium citrate anticoagulant; exclusion of disease and medication interference.
2) Analysis Platforms
SomaLogic: SomaScan 11K and 7K, utilizing SOMAmers (slow off-rate modified aptamers) with fluorescence detection.
Olink: Olink Explore 3072 (3K) and Explore HT (5K), based on proximity extension assay (PEA) and sequencing.
MS-based methods:
- MS-Nanoparticle (Seer Proteograph™ XT): Nanoparticle enrichment followed by data-independent acquisition (DIA) analysis.
- MS-HAP Depletion (Biognosys TrueDiscovery™): High-abundance protein depletion coupled with DIA.
- MS-IS Targeted (SureQuant™): Internal standard-triggered parallel reaction monitoring.
3) Data Analysis
Technical evaluation: Limit of detection (eLOD), data completeness, technical coefficient of variation (CV), and linear range.
Correlation analysis: Spearman’s rank correlation to assess protein abundance consistency across platforms.
Biological relevance: Multivariate linear models analyzed associations between age, sex, and protein levels, supplemented by pathway enrichment (Gene Ontology, Reactome).
Performance on Sensitivity, Precision, and Biomarker Discovery
1) Technical Evaluation
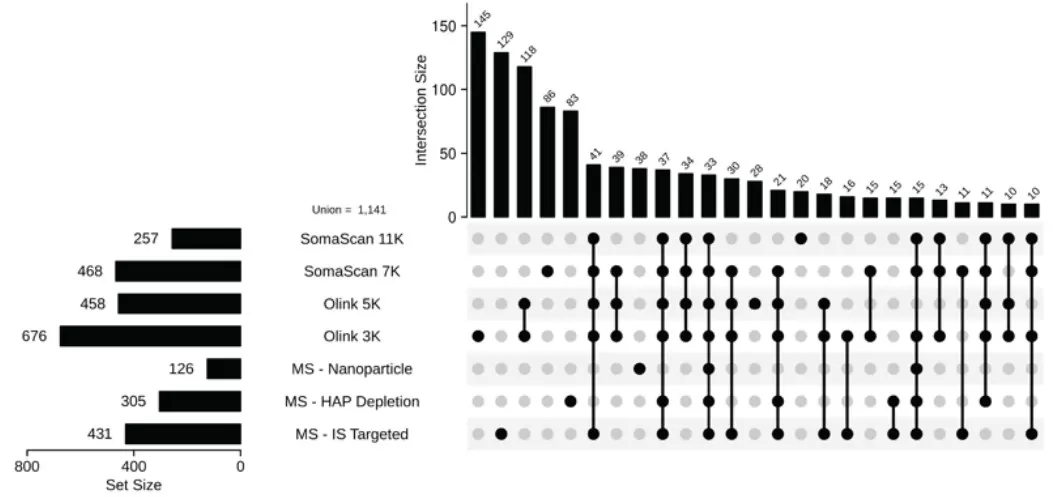
Across all seven platforms, 13,007 unique plasma proteins (UniProt IDs) were identified in healthy plasma.
- SomaScan 11K and 7K demonstrated the broadest proteome coverage, detecting 9,645 and 6,401 proteins, respectively, with 3,610 and 1,954 unique proteins exclusive to each platform.
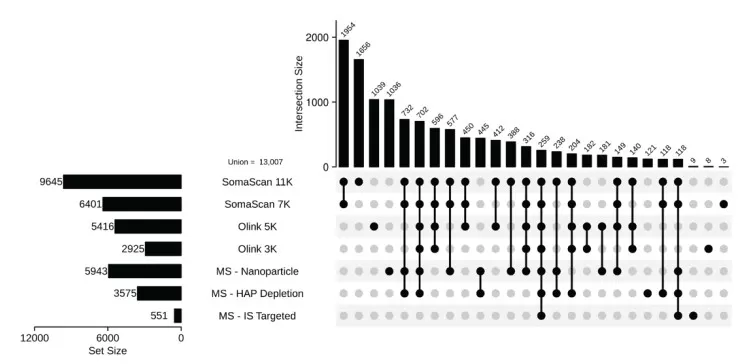
UpSet plot showing the intersection of proteins identified by platform
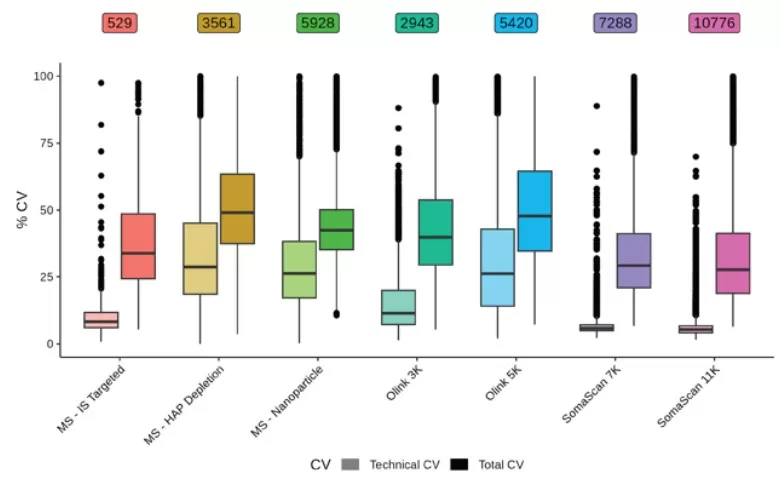
Technical and total CVs shown for each analyte on each platform
Precision: SomaScan exhibited the lowest technical CV (median CV: 5.3% for 11K, 5.8% for 7K), while Olink 5K showed higher variability (median CV: 26.8% vs. 11.4% for Olink 3K). Filtering Olink 5K data above eLOD reduced CV to 12.4% but eliminated 40% of analytes.
Data completeness: SomaScan 11K/7K achieved 96.2%/95.8%, versus 35.9% for Olink 5K.
FDA-approved biomarkers: SomaScan 11K/7K covered 88%/76%, outperforming other platforms.
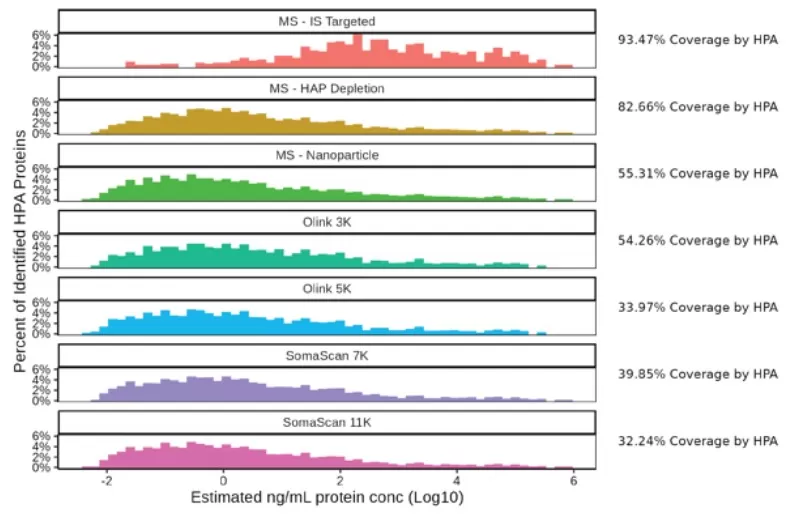
The detected proteins present in the HPA dataset were binned according to the estimated concentrations from the HPA dataset
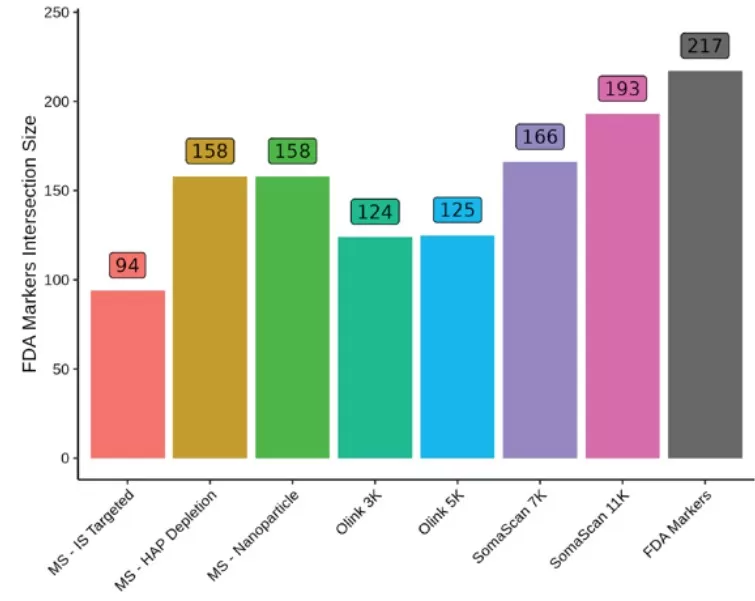
The number of FDA approved protein biomarkers identified by each platform.
These results suggest that platform selection should balance sensitivity, data completeness, and the practical needs of the study, rather than relying on a single headline metric such as panel size or throughput alone.
2) Correlation of Shared Proteins
The analysis of overlapping proteins across platforms revealed notable similarities and differences in protein identification and quantification. The highest overlap (3,978 proteins) was observed between SomaScan 11K and MS-Nanoparticle, followed by SomaScan 11K and Olink 5K (3,720 overlapping proteins). Subsequent correlation analysis of protein intensity measurements demonstrated strong within-platform consistency: SomaScan 11K and 7K versions showed a Spearman correlation of 0.79, while Olink 5K and 3K exhibited a correlation of 0.74. Notably, the Olink 5K platform displayed weaker inter-platform correlations compared to its 3K counterpart, whereas SomaScan versions maintained comparable median correlations with external platforms. Among mass spectrometry techniques, MS-IS Targeted demonstrated the strongest cross-platform correlations (Spearman coefficients: 0.35 with MS-Nanoparticle, 0.46 with MS-HAP Depletion, 0.49 with SomaLogic 7K, 0.50 with SomaLogic 11K, 0.56 with Olink 5K, and 0.62 with Olink 3K).
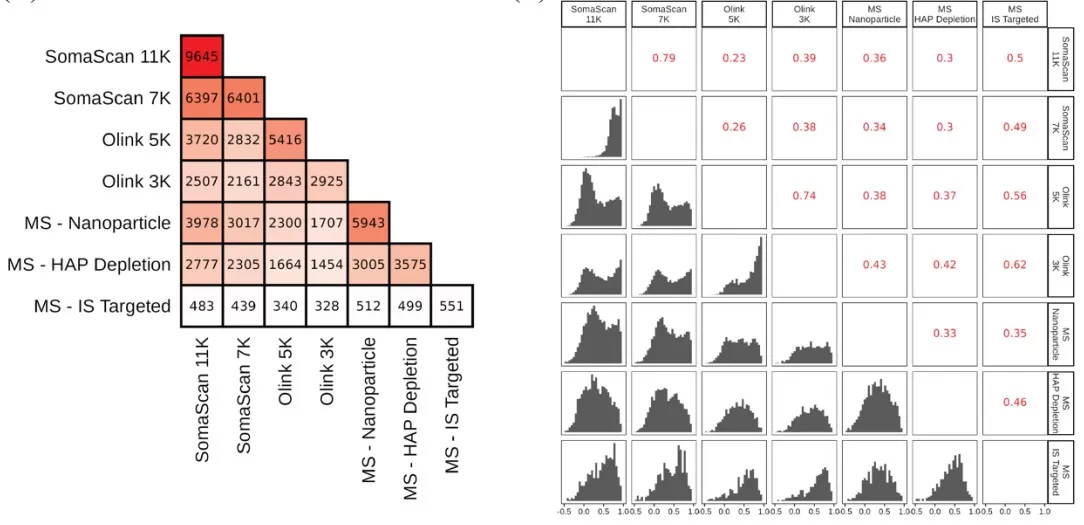
Intersection sizes of detected proteins between each pair of platforms and the distribution of Spearman Rho correlation coefficient
A bimodal correlation pattern was observed across all platforms except MS-Nanoparticle, suggesting distinct protein subgroups with differential correlation behaviors. To investigate this phenomenon, we focused on 259 proteins common to all platforms. When stratified into two groups based on coefficient of variation (CV) thresholds (CV <20% vs. >20%), proteins with lower variability (CV<20%) exhibited significantly higher inter-platform correlations. Additional analysis revealed a pronounced inverse relationship between data completeness percentage and measurement variability (CV). These findings collectively highlight the critical roles of both protein stability and data quality in determining platform comparability.
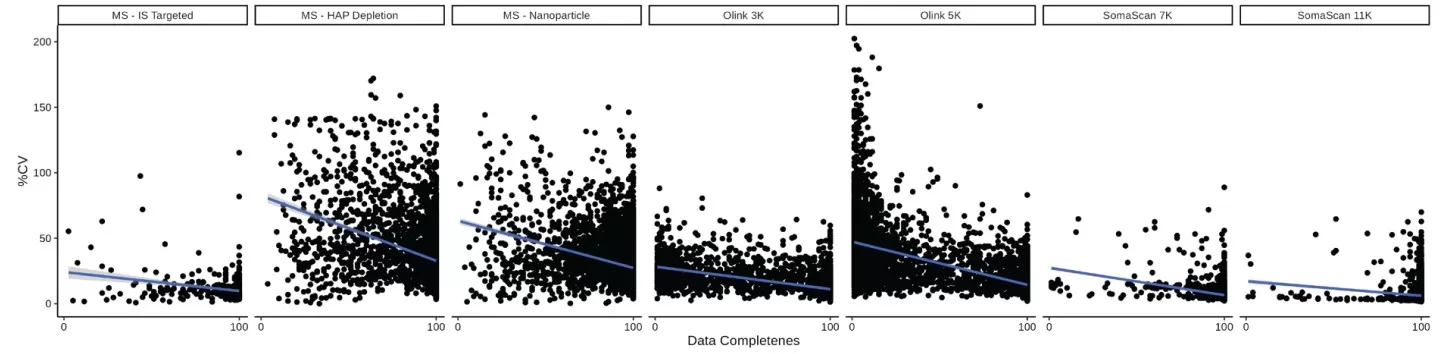
Percent CV versus Data Completeness for each analyte across each of the platforms
For researchers, this means that cross-platform overlap does not automatically imply identical quantitative behavior, and orthogonal validation remains important when biomarker candidates are prioritized.
Age Biomarkers and Cross-Platform Data Validation
Among all biological factors analyzed in this study, age-related biomarkers were examined in detail. The SomaScan 11K platform identified the highest number of unique age-associated markers (282), which were not detected by any other platform, followed by Olink 3K and Olink 5K with 176 and 99 exclusive markers, respectively. Seven proteins (P07998, P10645, P17936, P18065, P49747, Q15113, and Q9NQ79) emerged as age-related biomarkers across all platforms. Notably, P18065 (insulin-like growth factor-binding protein 2, IGFBP2) and P17936 (insulin-like growth factor-binding protein 3, IGFBP3)—members of the insulin-like growth factor (IGF) binding protein family—are well-established aging markers previously identified in plasma proteomic studies. P07998 ranked among the top 20 SOMAmers most significantly associated with chronological age.
Although inter-platform correlations for shared proteins were generally modest, age-associated biomarkers common across platforms demonstrated high consistency. Pathway analysis of significant age-related markers revealed distinct enrichment patterns among platforms. SomaScan 11K, SomaScan 7K, and Olink 5K showed significant enrichment in Gene Ontology (GO) terms and Reactome pathways related to molecular functions, cellular components, and biological processes.
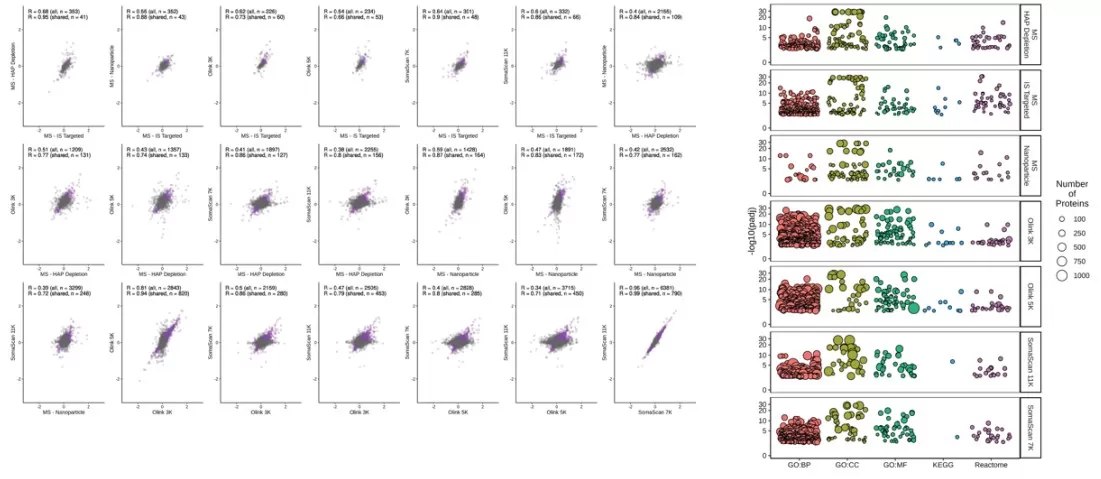
Correlation of coefficients between models for the shared aging marker proteins across different platforms, and enrichment analysis using significant age markers from each platform
To assess the relevance of the identified age markers, we compared significant biomarkers from all platforms with those reported in the UK Biobank Pharma Proteomics Project (UKB-PPP), which profiled the plasma proteome of 54,219 participants using the Olink Explore 3072 platform. The overlap between age-related markers identified on each platform and those reported in the UKB dataset further supported the biological relevance of the shared biomarker signals. The observed concordance further supports the biological relevance and reliability of age-associated biomarkers detected across different proteomic platforms.
The number of UKB markers detected in both the platform of interest and the UKB dataset is shown in grey
This also highlights that biological relevance and technical comparability are related but not identical, and study design should be aligned with the specific biomarker question being asked.
Which Proteomics Platform Is Best for Your Research Goals?
This study provides a critical framework for optimizing proteomics workflows, balancing coverage, precision, and biological relevance. Proteomic platforms exhibit substantial differences in protein class coverage. Non-affinity-based mass spectrometry (MS) platforms enable unbiased protein detection through untargeted or targeted approaches without predefined protein selection, offering advantages in novel protein discovery and post-translational modification analysis. Additionally, these platforms, such as the MS-IS Targeted method mentioned in the study, can achieve absolute quantification when required.
In contrast, affinity-based platforms demonstrate distinct strengths, with SomaScan 11K providing the broadest coverage. When assessing biological relevance, a linear model combined with meta-analysis revealed that SomaScan 11K outperformed other platforms in identifying biomarkers associated with age, BMI, and sex. Specifically, it detected the highest number of unique age-related markers, while seven proteins—including well-established aging biomarkers such as IGFBP2 and IGFBP3—were consistently identified across all platforms. Moreover, both SomaScan versions maintained low coefficients of variation (CV), reinforcing their reliability for large-scale population proteomic studies.
Finally, cross-validation with the UK Biobank Pharma Proteomics Project (UKB-PPP) dataset further confirmed the biological relevance and robustness of the biomarkers identified across platforms. Collectively, this study not only provides an in-depth evaluation of different proteomic platforms' performance and characteristics but also serves as a critical reference for optimizing proteomic research methodologies and platform selection.
FAQs for proteomics
Q1. Which proteomics platform is best for plasma biomarker discovery?
There is no single best platform for every plasma biomarker study. Olink is often useful for sensitive profiling of predefined targets, SomaScan is attractive for very large cohort-scale affinity profiling, and MS-based workflows are preferred when broader discovery depth or mechanistic interpretation is required.
Q2. Can Olink or SomaScan detect PTMs?
Not directly. Affinity-based platforms such as Olink and SomaScan are designed for protein abundance measurements on predefined panels, while PTM detection is typically performed by mass spectrometry-based proteomics.
Q3. When is MS-DIA a better choice than affinity-based proteomics?
MS-DIA is usually the stronger option when the study requires untargeted discovery, PTM analysis, isoform-level insight, or broader flexibility across tissues, cells, and biofluids.
Q4. Is Olink better than SomaScan?
Neither platform is universally better. Olink is often favored for sensitive low-input measurements of predefined targets, while SomaScan is particularly valuable for ultra-high-throughput, broad affinity-based profiling in large population studies.
Q5. Can multiple platforms be combined in one project?
Yes. In many studies, researchers use one platform for broad screening and another for orthogonal validation or deeper characterization. Combined strategies can be especially useful when both throughput and biological depth are important.
MetwareBio: Turn Platform Choice Into a Practical Study Plan
Different proteomics platforms answer different biological questions. Whether your study prioritizes untargeted discovery, low-input biomarker screening, or large-cohort plasma profiling, the most effective workflow depends on your sample type, cohort size, and research goal.
At MetwareBio, we support researchers with MS-based proteomics solutions and project-oriented study design guidance to help translate platform choice into a practical downstream strategy. If you already know your sample type and study objective, our team can help you build the most suitable proteomics workflow.
Read more
- What’s the difference between DIA and DDA?
- Olink Proteomics Explained-Principles, Advantages, and Comparison MS-Based Methods
- Alamar Proteomics Technology- Principles and Advantages of the Nulisa and Argo HT Systems
- SomaScan Proteomics Technology-Principles and Advantages
- TMT Quantitative Proteomics-A Comprehensive Guide to Labeled Protein Analysis
- TMT vs. DIA-Which Method Reigns Supreme in Quantitative Proteomics
- Proteomics Success at the Start: A Guide to Effective Sample Collection
- Key Methods in Proteomics: Protein Extraction Techniques for Animal Tissues
- Key Methods in Proteomics: Protein Extraction Techniques for Plant Samples
- Key Methods in Proteomics: Protein Extraction Techniques for Biological Fluids
- Enhancing Protein Analysis: A Comprehensive Guide to Protein Digestion and Desalting in Proteomics
References
- Ahadi S, et al. Current landscape of plasma proteomics from technical innovations to biological insights and biomarker discovery. Communications Chemistry. 2025.
- Comparative evaluation of Olink Explore 3072 and mass spectrometry with peptide fractionation for plasma proteomics. Communications Chemistry. 2025.
- Olink Proteomics. Proximity Extension Assay (PEA) technology overview. Official technology resource.
Next-Generation Omics Solutions:
Proteomics & Metabolomics
Ready to get started? Submit your inquiry or contact us at support-global@metwarebio.com.
